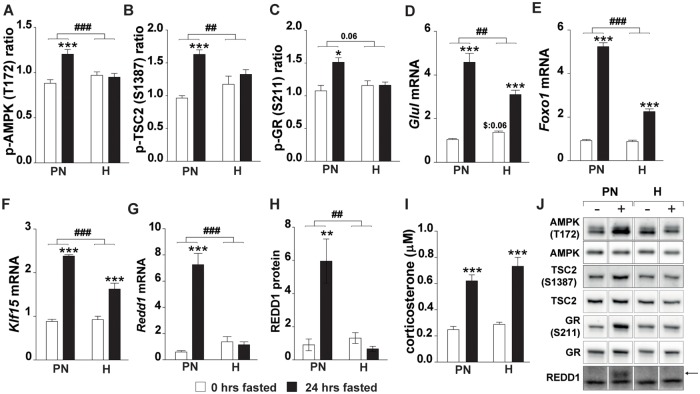
Fig 5. Fasting-induced control of mTORC1 activity by AMPK/TSC2 signaling is altered by hypoxia.
(A) Ratio of p-AMPK (T172) over total AMPK. (B) Ratio of p-TSC2 (S1387) over total TSC2 (for total TSC2 see Fig 5B panel 6). (C) Ratio of p-GR (S211) over total GR. mRNA expression of GR target genes: (D) Glul, (E) Foxo1, (F) Klf15, (G) Redd1. (H) Redd1 protein. (I) Plasma corticosterone concentration (J) Representative images of Western blots (reordered to match figures). Data are normalized to the basal expression of the normoxic group at day 0. Significant differences are indicated by (*): comparing 0 hrs fasted and 24 hrs fasted for each condition, * = P< 0.05, ** = P≤ 0.01 or *** = P≤ 0.001. Trends (0.05 ≤ P ≤ 0.1) are indicated by the specific P-value. ($): comparing PN- and H-group to N-group at 0 hrs fasted, (#): comparing the differences in response to fasting between PN- and H-group. (n = 6–8).

