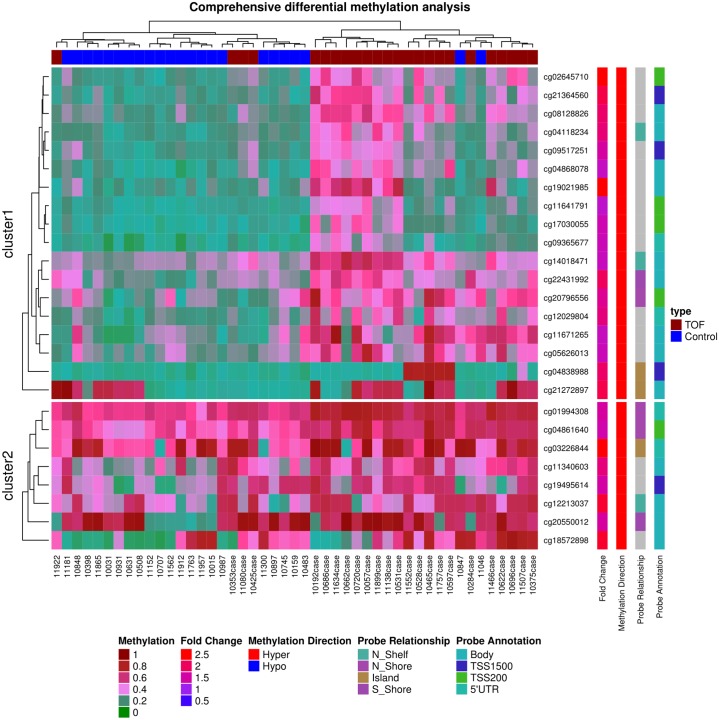
Fig 2. Heatmap of 26 highly differentially methylated loci.
DNA methylation profiling based on unsupervised hierarchical clustering identified four unique clusters that have distinct methylation signatures. These 26 targets represent the most highly differentially methylated loci (False Detection Rate < 0.000001). Only CpG sites shown are those with either 2.0-fold hypomethylated or 2.0-fold hypermethylated in the disease TOF cases (red colored squares) compared to control subjects (blue colored squares). The figure also displays direction, fold change in disease, probe relationship and probe annotation of differentially methylated CpG sites. The red color in the heatmap indicates hyper DNA-methylation and blue hypo DNA-methylation values.

