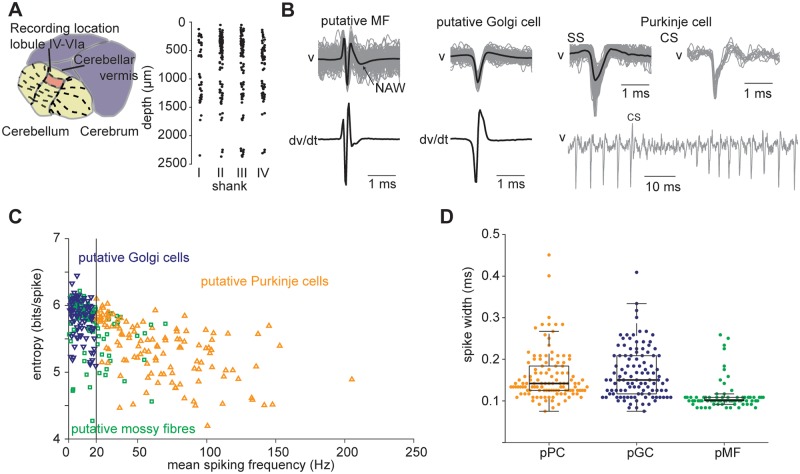
Fig 2. Cell classification of cerebellar units.
(A) Left: recording location area. Right: depth of single units (n = 310) from the cerebellar surface grouped by shank (I-IV) for all mice. Depth measurements are based on the position of the channel in which the greatest spike amplitude of the signal is recorded. (B) Examples of action potential waveforms for a putative mossy fibre, Golgi cell and Purkinje cell. Gray traces are single waveforms (100 randomly chosen spike events). The spike duration was computed by estimating the distance between the peaks of the first derivative of the mean action potential trace—shown for the putative mossy fibre and Golgi cell examples. Complex spike mean waveform is averaged from twelve action potentials. Note the pause in simple spiking following the complex spikes. (C) Entropy and mean spiking frequency computed during stationary periods of all units. Black line shows threshold for putative Purkinje cell/Golgi cell classification. (D) Waveform durations of the three classes of putative Purkinje cells (pPC, n = 122), Golgi cells (pGC, n = 111) and mossy fibres (pMF, n = 77).

