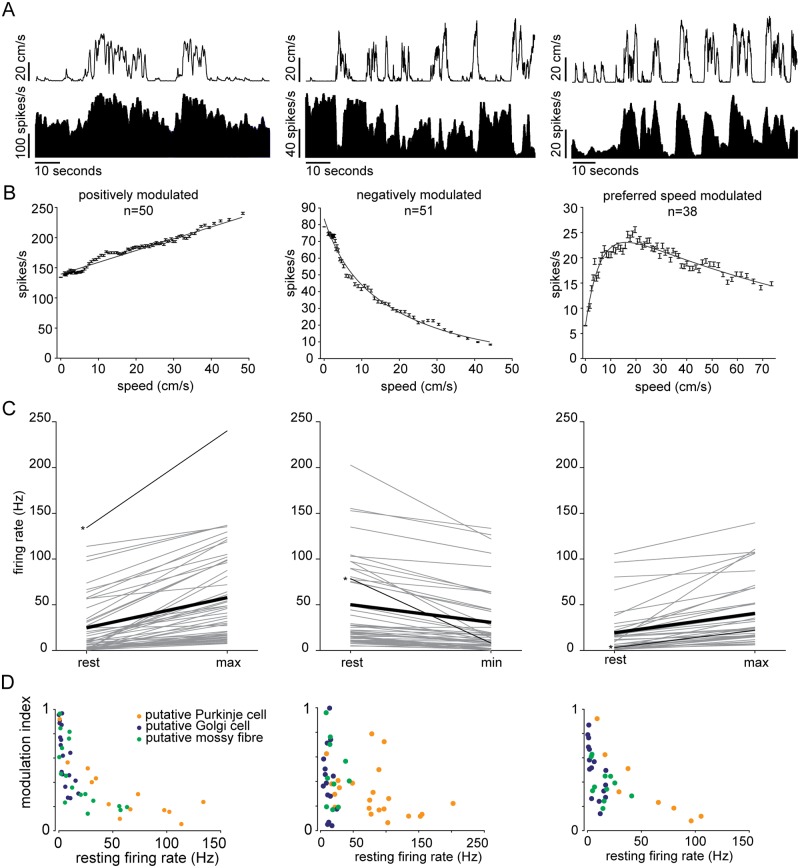
Fig 3. Cerebellar neuronal response to locomotion speed.
(A) Speed and instantaneous firing rate of three example units for the three response profiles observed (bins = 0.5 seconds). (B) Speed tuning curves of the examples in A; error bars are standard errors. (C) Mean firing rate during stationary periods and speeds at which maximal firing rate is recorded. Gray lines are single units; thin black lines with asterisks on the left indicate units shown in A and B; thick black lines are average firing rates of all units within each response class. (D) Modulation indexes shown as a function of resting firing rate (i.e. during stationary periods), for each response type.

