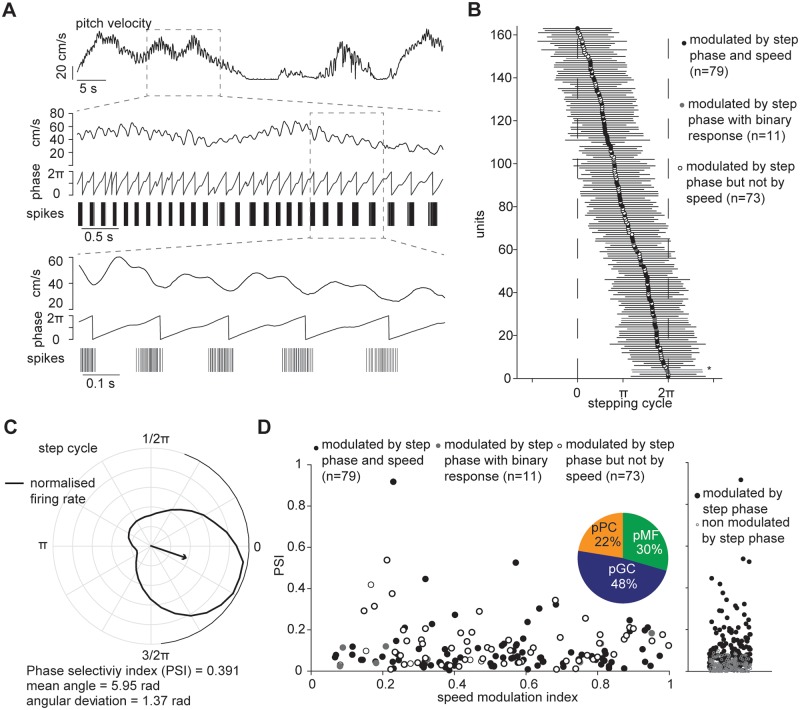
Fig 5. Cerebellar neuronal response to stepping cycle.
(A) Top: pitch velocity signal; centre: boxed pitch velocity signal aligned with its Hilbert transformed signal (middle) and spike events of an example unit; bottom: close-up of approximately one second. (B) Preferred phases of units significantly modulated by stepping cycle (n = 163); horizontal bars indicate standard circular deviations. Unit 5, shown in A and C is marked by the asterisk. (C) Polar plot showing the preferred locomotion phase of normalised firing rate for the same unit shown in A; arrow indicates mean angle direction and phase selectivity index, PSI (magnitude of mean response); black solid line around the circle is the circular standard deviation. (D) PSI of units modulated by step phase as a function of speed modulation index. Inset, pie chart of putative cerebellar neurons modulated by stepping phase; pPC: putative Purkinje cells; pCG: putative Golgi cells; pMF: putative mossy fibres. Right, distribution of PSI of these units.

