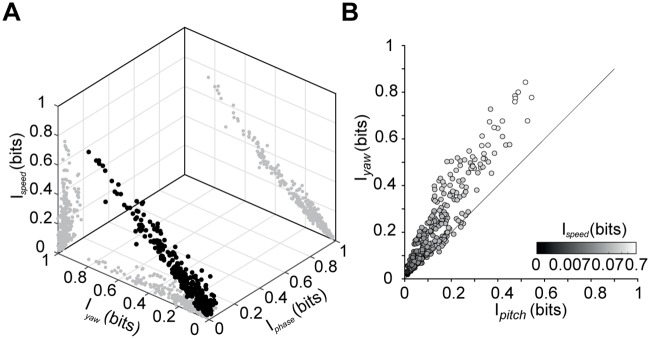
Fig 7. Mutual information between firing rate time series and kinematic parameters.
(A) Information about speed, yaw and phase within the step cycle, for each cell (n = 310). Black points plot the three-dimensional joint distribution; gray points show two-dimensional marginals. (B) Mutual information values of the two vectorial components (pitch and yaw) of speed. Grayscale indicates the value of mutual information between firing rate and speed for each cell (n = 310).

