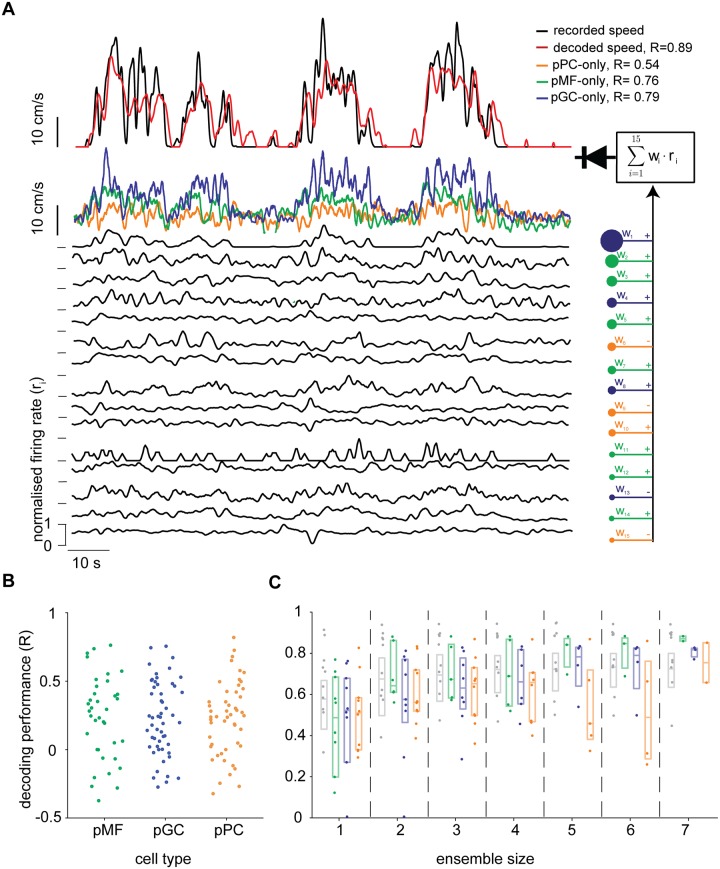
Fig 8. Speed of locomotion can be linearly reconstructed from the activity of a small heterogeneous population of cerebellar neurons.
(A) Diagrammatic representation of the optimal linear decoder used to reconstruct locomotion speed, showing one example experiment comprising the three putative cell types (Purkinje cells: pPC; Golgi cells: pGC; mossy figres: pMF). Top: above, time course of original speed signal and decoded trace using the entire population; below, decoded speed traces using only homogeneous ensembles. Bottom: normalised firing rate of all units used for the decoder. Right: firing rates of all units, color-coded according to their putative cellular type, are weighted and linearly summed, then half-wave rectified (diode symbol). (B) Decoding performance for all experiments with at least 8 units recorded, (n = 10). (C) For the same 10 experiments used in panel (B), the scores of the best performing ensembles, selected from random samples (see Results), plotted as a function of the number of units for the selected experiments. For each ensemble size, four different measures are shown: the performance of heterogeneous populations (grey) and of homogeneous ensembles (colour-coded as in panel A).

