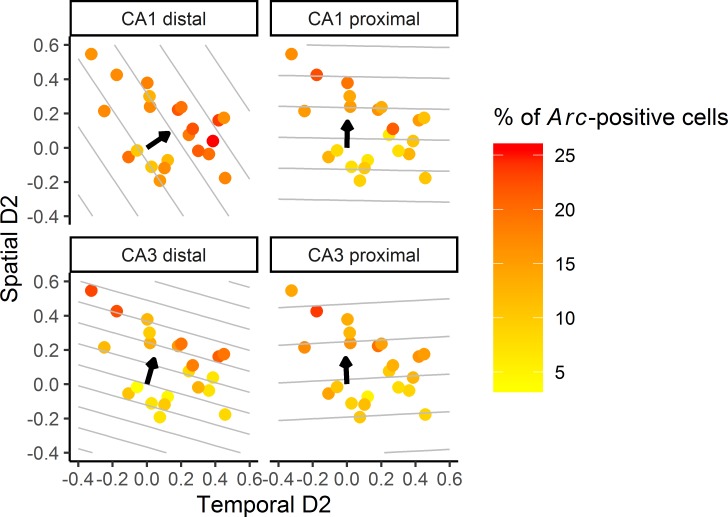
Fig 4. Arc expression varies with temporal and spatial discrimination in a distinct manner in the distal and proximal parts of CA1 and CA3.
Scatter plots of Arc expression as a function of both temporal and spatial D2 ratios. Overlaid are contour lines predicted by the linear mixed model that estimates each area’s level of Arc activity based on both D2 ratios concurrently. Distal CA1 shows the strongest increase in activity with increasing retrieval of temporary information (i.e., contour lines are more vertical), while Arc expression increases more with retrieval of spatial information in all other areas (i.e., contour lines are more horizontal). The arrow indicates the preferred direction of Arc variation (underlying data in Supporting Information S2 and S3 Data).

