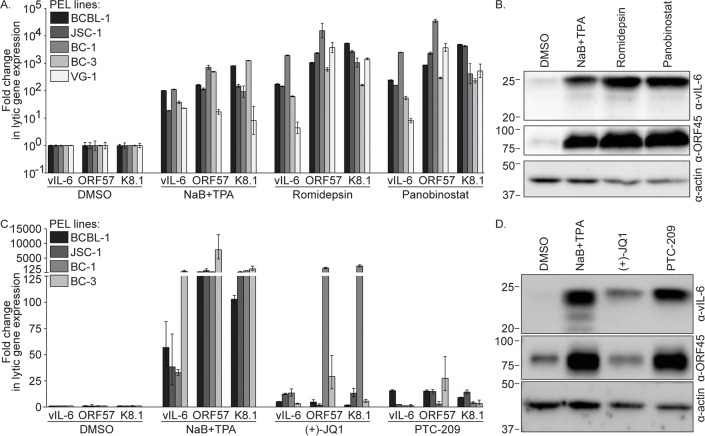
Fig 2. Romidepsin, Panobinostat, (+)-JQ1, and PTC-209 induce KSHV lytic gene expression.
(A) RT-qPCR analysis for KSHV lytic transcript levels was performed on PEL cells treated with DMSO, NaB+TPA, or 1 μM Romidepsin or Panobinostat for 48 hours. Lytic transcript levels were normalized to GAPDH, and the fold difference between DMSO and compound treated cells was calculated. (B) Immunoblot analysis for vIL-6, ORF45, or actin was performed on lysates from BCBL-1 cells treated as in (A). Approximate molecular mass (kDa) marker positions are indicated to the left of each blot. (C) RT-qPCR analysis for KSHV lytic transcript levels was performed as in (A) on PEL cells treated with DMSO, NaB+TPA, or 10 μM (+)-JQ1 or PTC-209 for 120 hours. (D) Immunoblot analysis was performed on lysates from BCBL-1 cells treated as in (C). Data are representative of at least two independent experiments performed in triplicate; mean and standard error are shown.

