
Figure 1.
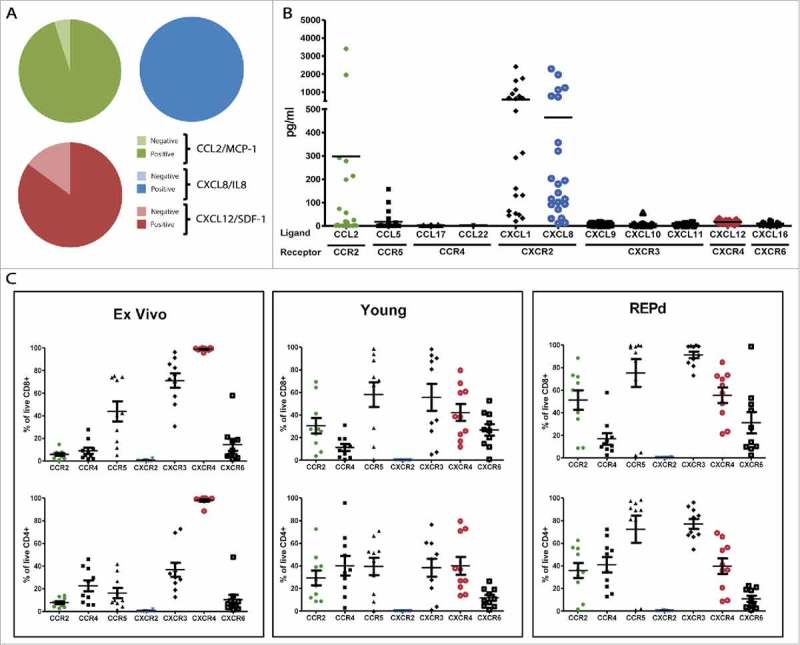
Chemokine profile of MM, and corresponding chemokine receptor expression on MM tumor infiltrating T cells. Initial analyses of mRNA expression in 20 melanoma cell lines of 3 select chemokines CCL2, CXCL8/IL-8 and CXCL12/SDF-1 by standard PCR (A), and subsequent luminex analyses of 11 select chemokines secreted into the supernatant of 22 MM cell lines after 48 h (B). Expression of corresponding chemokine receptors on CD4+ and CD8+ TIL either ex vivo, in young or REPd cultures analysed by 8-color flow cytometry (C). MM = Melanoma cell lines, n = 20 (PCR), 22 (Luminex); TIL = Tumor infiltrating lymphocytes, n = 10 Green = CCL2/CCR2; Blue = CXCL8/CXCR2; Red = CXCL12/CXCR4. Horizontal bars designate mean, error bars designate standard error of the mean.