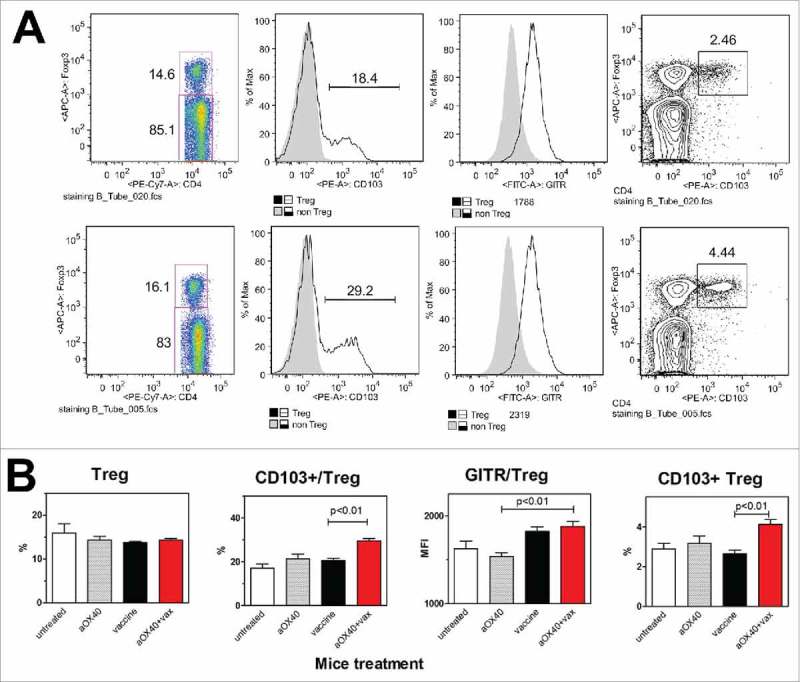
Figure 3.

Effect of aOX40+vax combined treatment on Treg number and phenotype. (A) Cytofluorometric plots of a representative mouse per group (at 17 weeks of age): vaccine alone (upper row), aOX40+vax (lower row). Panels from left to right show: Treg frequency over total splenocytes, CD103+ cells over Treg, GITR expression level (Mean fluorescence intensity, MFI) over Treg, CD103+ Treg frequency in gated CD4+ splenocytes. (B) Each bar represents the mean and SEM from mice of the different groups studied (at 17 weeks of age). For comparison, data from untreated mice and from mice treated with aOX40 alone are shown. Groups: untreated, n = 3; aOX40, n = 10; vaccine, n = 20; aOX40+vax, n = 25. Significance at the Student's t test is reported.
