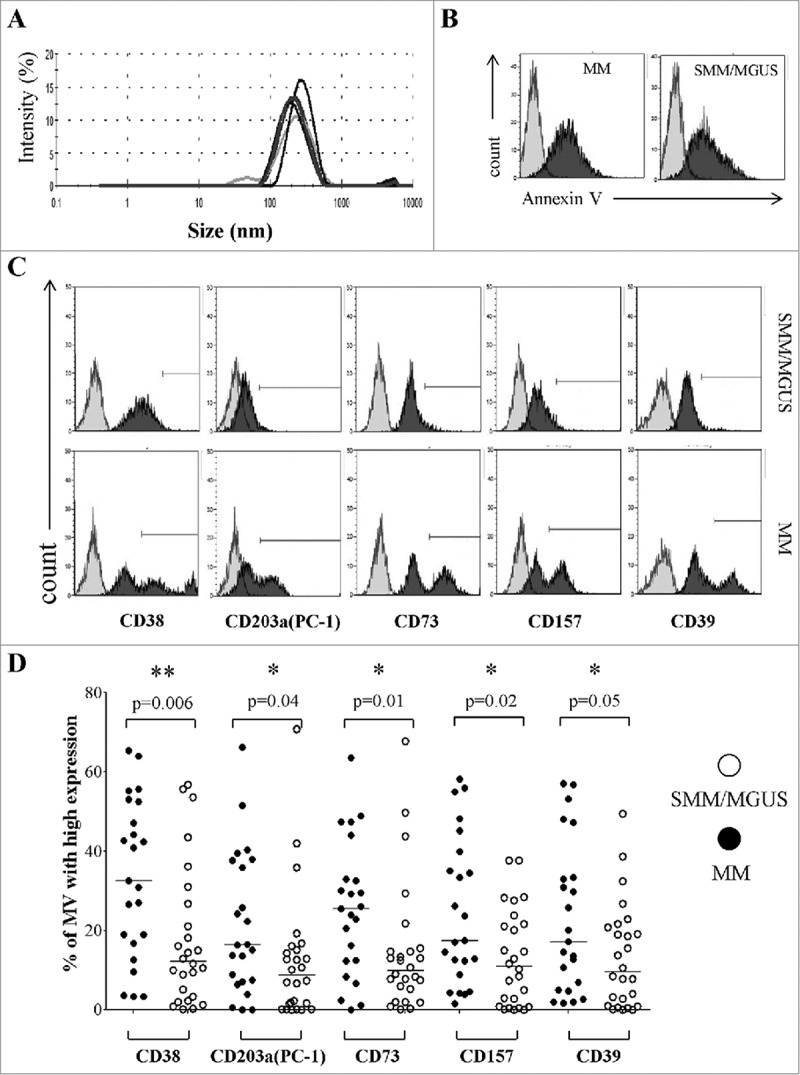
Figure 2.

Expression of CD38, CD203a(PC-1), CD73, CD157 and CD39 in MVs from the BM of patients with MM or MGUS/SMM. Panel A represents the characterization of the size and distribution of MVs by Particle Sizer. Panel B shows a representative experiment performed in pooled MV from 5 MM patients and 5 controls (MGUS/SMM). Grey profiles indicate unstained MVs and black profiles indicate MVs stained with Annexin V. Panel C shows a representative experiment performed in MM patients and controls (MGUS/SMM). Grey profiles indicate MVs stained with irrelevant isotype-matched mAbs and black profiles indicate MVs stained with specific mAbs. Panel D shows percentages of MVs expressing high levels of ectoenzymes. Mv were isolated from 27 MM patients (black dots) or 25 MGUS/SMM patients (controls, white dots). Horizontal lines indicated medians. p values are indicated when differences are statistically significant.
