
Figure 4.
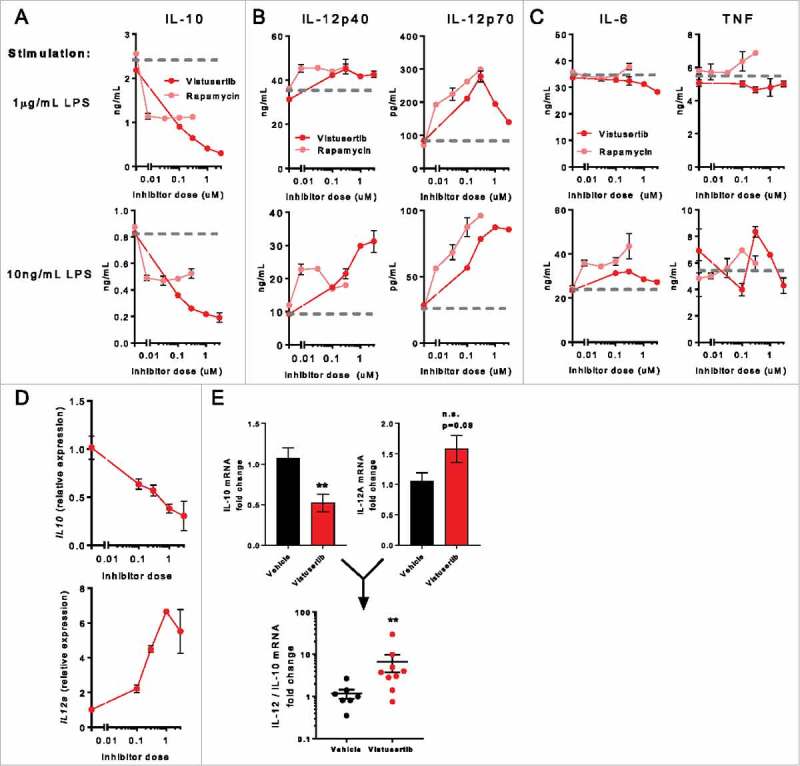
mTOR inhibition promotes a proinflammatory cytokine profile in DCs. Bone marrow derived DCs (BMDCs) were pre-incubated with indicated concentrations of inhibitors for 2h, then stimulated overnight with indicated quantities of LPS. (A) IL-10, (B) IL-12p40 and IL-12p70, (C) IL-6 and TNF were quantified in culture supernatant by ELISA. (D) Gene expression profiling was performed on LPS-activated BMDCs. Line graphs show expression of IL12a and IL10 expression normalized to controls. Data represent ≥2 experiments. (E) CT-26 tumours bearing mice were treated with vistusertib or vehicle from day 1 post implantation. Bulk tumours were lysed and RNA was analysed by fluidigm on day 11 after first dose. Bar graphs show expression of IL-10 or IL-12A mRNA, scatter bar chart shows the IL-12/IL-10 mRNA ratio for individual mice. Statistical differences were calculated with a Mann-Whitney test. Data represent n=9 per group.