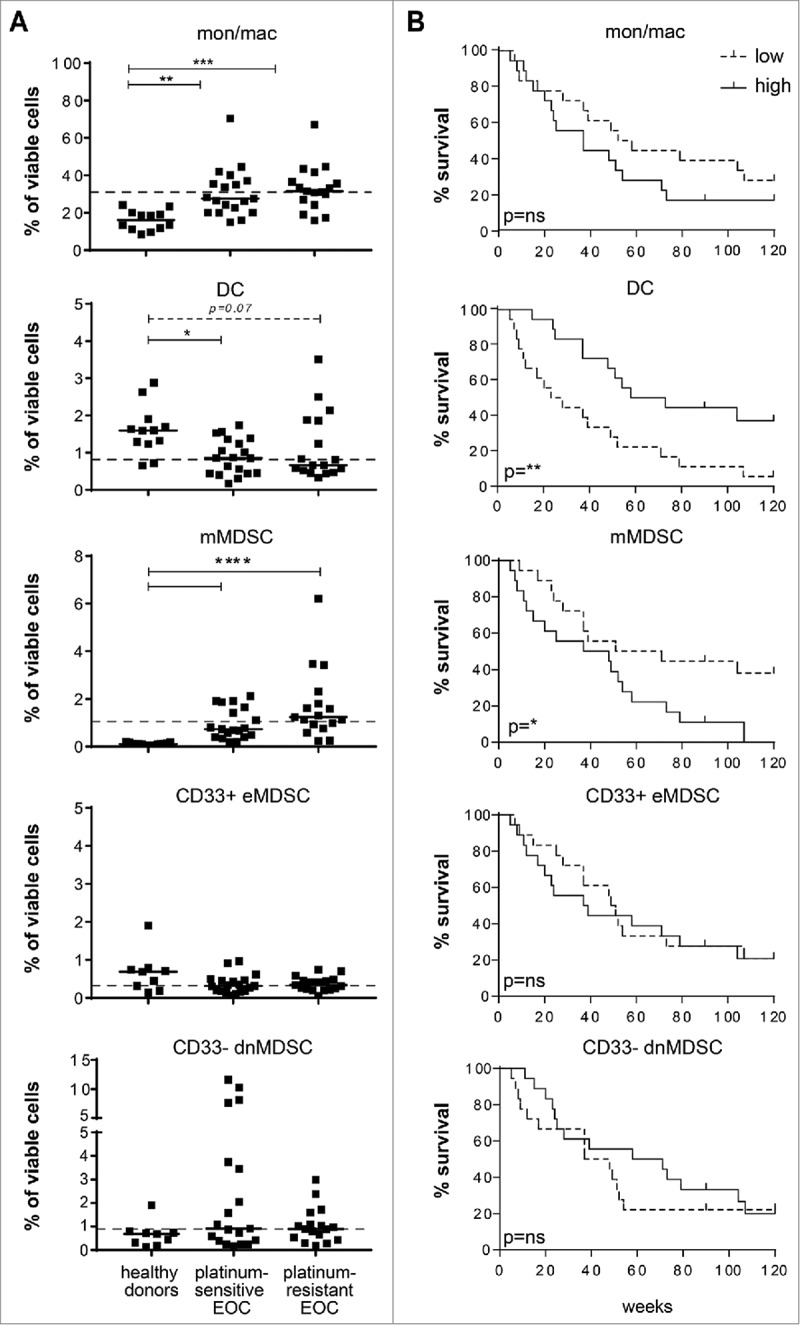
Figure 2.

High frequencies of circulating monocytic MDSC and low frequencies of circulating DC are associated with poor outcome in EOC. An in-depth analysis of the circulating myeloid cell compartment was performed in EOC at baseline. To this end, PBMC samples of healthy donors and platinum–sensitive and –resistant EOC patients were analyzed by multi-parameter flow cytometry for the presence of CD3-CD19-CD56-HLA-DR+CD14+CD11b+ total monocytes/macrophages, CD3-CD19-CD56-HLA-DR+CD14-CD11 c+ DC, CD3-CD19-CD56-HLA-DR−/lowCD14+CD15- monocytic MDSC (mMDSC), CD3-CD19-CD56-HLA-DR−/lowCD14-CD15- and CD33+CD11b+ early-stage MDSC (CD33+ eMDSC) and CD3-CD19-CD56-HLA-DR−/low and CD14-CD15- double-negative (dn) CD33-CD11b+ MDSC (CD33- dnMDSC). A) The frequencies of total monocytes/macrophages (mon/mac), DC, mMDSC, CD33+ eMDSC and CD33- dnMDSC (from top to bottom) are depicted as percentage of total viable cells for healthy donors (left), platinum–sensitive (middle) and –resistant (right) EOC patients at baseline. The dotted line marks the median frequency of the total EOC patient group. Differences between healthy donors and patients were analyzed by two-sided Kruskal–Wallis test with a post hoc Dunn's multiple comparison test. Differences were considered significant when p < 0.05, as indicated with an asterisk (*p < 0.05, **p < 0.01, *** p < 0.001 and **** p < 0.0001). B) Kaplan-Meier plots showing the survival of a cohort of 36 EOC patients. Patients were divided into low or high groups according to the median frequency of the designated myeloid cell subpopulations for the total EOC patient population. The solid line depicts patients with frequency of the population above the median and the dotted line depicts patients with frequency below the median of the total EOC group. Statistical significance of the survival distribution was analyzed by log-rank testing.
