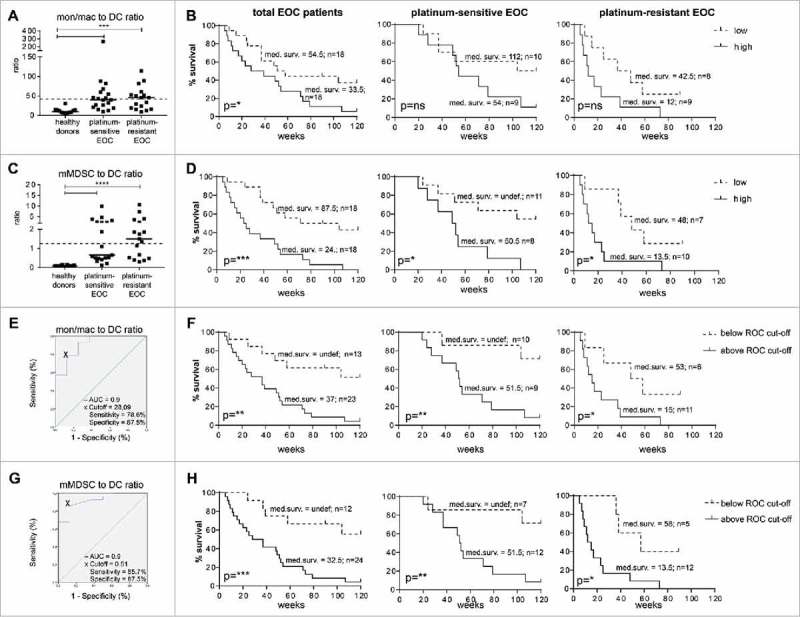
Figure 5.

The pre-treatment circulating mMDSC to DC ratio is an independent predictive factor for patient survival that is relevant beyond type of chemotherapy or disease stage. Monocyte/macrophage (mon/mac) to DC (A) and mMDSC to DC (C) was calculated by dividing the mon/mac or mMDSC value by the DC value measured at baseline. A, C) The mon/mac to DC (A) and mMDSC to DC (C) ratios are depicted for healthy donors, and platinum–sensitive and –resistant EOC at baseline. The dotted line marks the median ratio of the total EOC patient group. B, D) Kaplan-Meier plots showing the survival of the total cohort of EOC patients (left), and the individual cohorts of platinum–sensitive (middle) and –resistant (right) EOC patients are given for the mon/mac to DC (B) and mMDSC to DC (D) ratio. Patients were divided into low or high groups according to the median of the total EOC patient population. The solid lines depicts patients with frequency of the population above the median (high) and the dotted line depicts patients with frequency below the median (low) of the total EOC group. E, G) Optimal cut-off point for the mon/mac to DC (E) and mMDSC to DC (G) ratios by ROC curve analysis is depicted. The black cross depicts the optimal cut-off point with respect to sensitivity and specificity. F, H) Kaplan-Meier plots showing the survival of the total cohort of EOC patients (left), and the individual cohorts of platinum–sensitive (middle) and –resistant (right) EOC patients are given for the optimized mon/mac to DC (F) and mMDSC to DC (H) cut-offs. The solid lines depicts patients with frequency of the population above the ROC cut-off and the dotted line depicts patients with frequency below the ROC cut-off. Statistical significance of the survival distributions were analyzed by log-rank testing. The number of patients and the corresponding median survival for each group is given in the plots.
