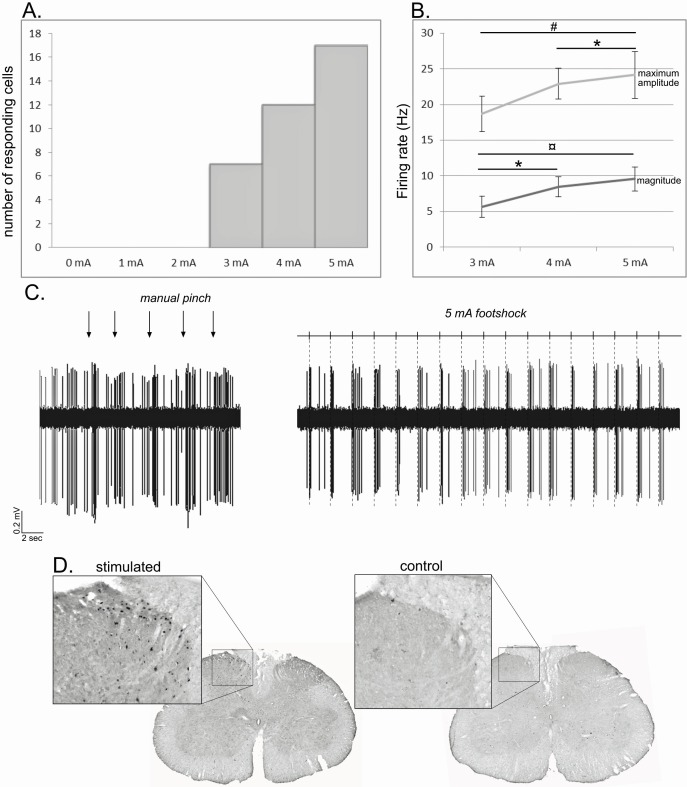
Figure 10. Noxious footshock.
(A) Histogram showing the increase in the number of responding cells with the increase of the footshock intensity. (B) Increase of the maximum amplitude and magnitude of phasic nociceptive-evoked responses with the increase of the footshock intensity. (C) Individual example of an STN cell excited both by a mechanical noxious stimulation (pinch – left) and a 5 mA noxious footshock (right). (D) Coronal sections of the lumbar region of the spinal cord processed for c-fos expression in an animal subjected to 1 hr unilateral noxious electrical stimulation of the hindpaw (left) and in a control animal in which the electrodes were implanted into the hindpaw, but no footshock applied.

