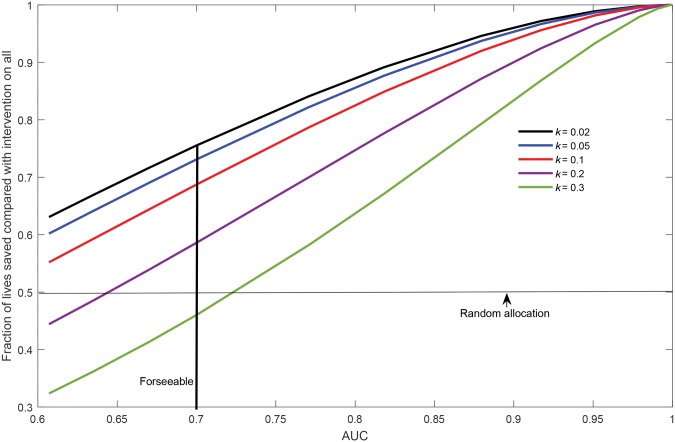
Figure 3.
Fraction of lives saved by risk-based allocation of mammograms, compared with giving screening mammograms to all women, as a function of area under the curve when there is only enough money to give mammograms to half the population. Results are shown for various ratios k of the cost of risk assessment to the cost of a mammographic screen. AUC = area under the curve.

