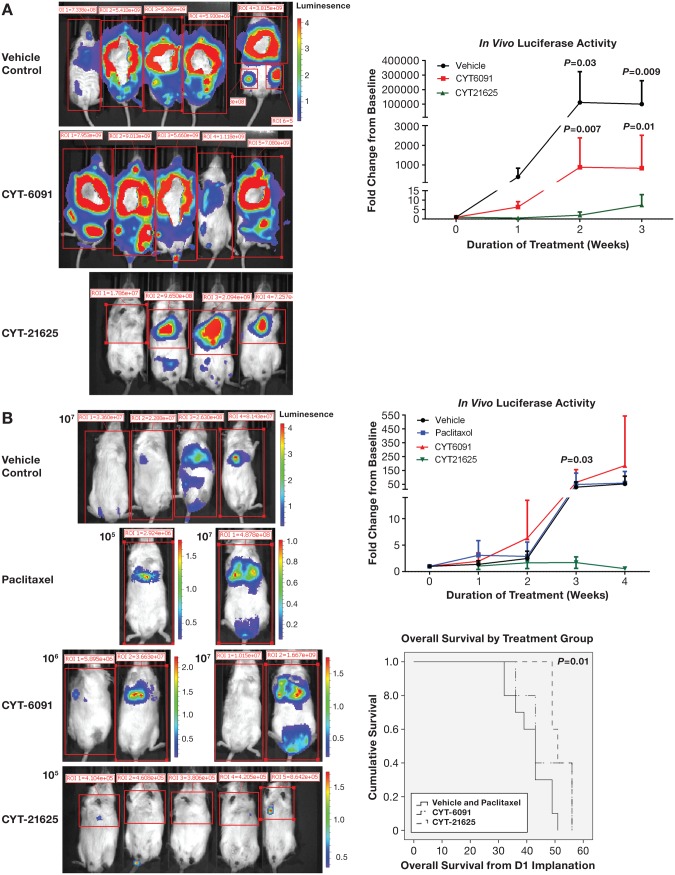
Figure 2.
In vivo whole-body luciferase activity in mice. A) Metastatic human anaplastic thyroid cancer (8505C) xenografts. P values indicate statistically significant differences when the luciferase activity in mice treated with vehicle (n = 7, black line) and CYT-6091 (n = 6, red line) was compared with CYT-21625 (n = 5, green line). B) Metastatic human follicular thyroid cancer (FTC-133) xenografts. P values indicate statistically significant differences when the luciferase activity in mice (n = 5 per group) treated with vehicle (black line), paclitaxel (blue line), and CYT-6091 (red line) was compared with CYT-21625 (green line). The two-sided Student t test was used to assess the difference in luciferase activity between groups.

