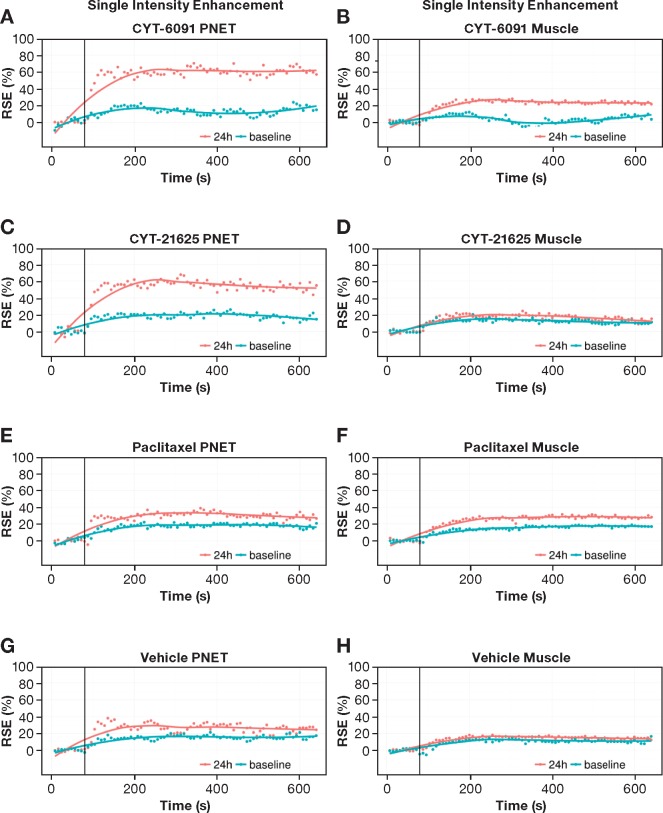
Figure 5.
Imaging vascular effects of CYT-21625 by dynamic contrast-enhanced magnetic resonance imaging (DCE-MRI). The signal enhancement curve was used for quantifying the tumor vasculature (A, C, E, G) and control muscle vasculature (B, D, F, H) by DCE-MRI. The first six time points are pre–injection of gadolinium with diethylenetriaminepentacetate (Gd-DTPA); the next 80 are post–injection of Gd-DTPA. E(t) = [S(Ct)-S(0)]/S(0), where S(0) is the signal absence of Gd-DTPA (Ct = 0) and S(Ct) is the signal after injection of Gd-DTPA. The data are from the pancreatic and control muscle regions of multiple endocrine neoplasia type 1 gene knock-out mice (n = 3) at 24 hours postinjection (red curve) and baseline (green curve). PNET = pancreatic neuroendocrine tumor; RSE = Relative signal enhancement.

