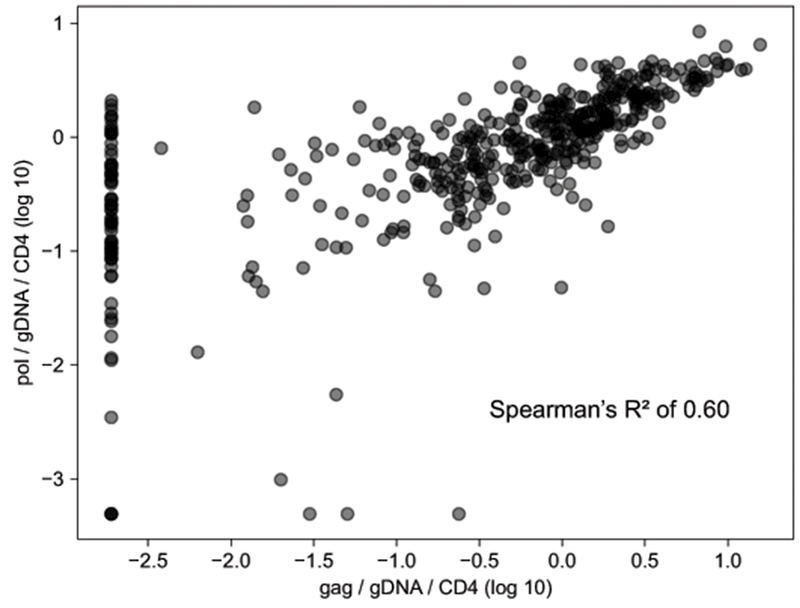
Figure 1: HIV DNA size as determined by quantitative PCR against the HIV gag or pol gene.

Each circle represents one sample. The x-axis is the reservoir size as determined by gag qPCR, the y-axis as determined by pol qPCR. There were 68 samples for which the pol gene amplified by the gag gene did not.
