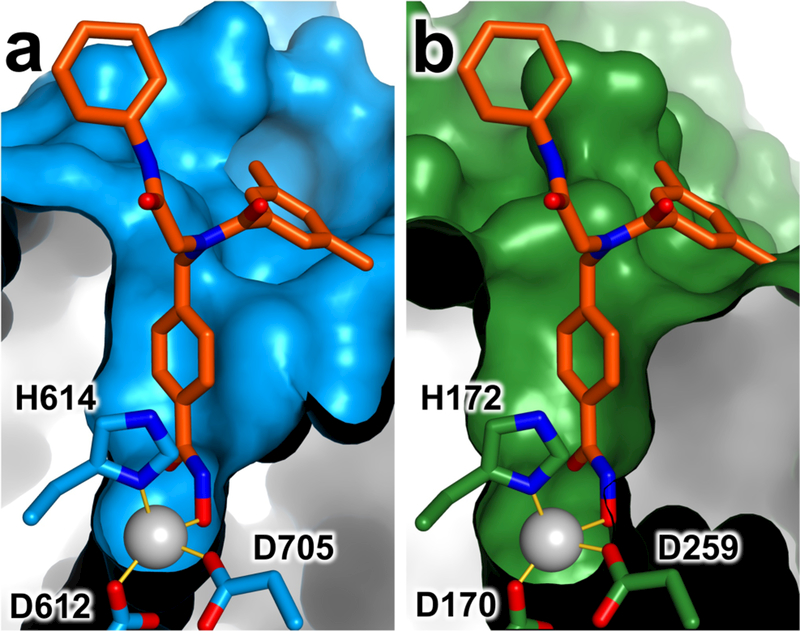
Figure 4.
Active site surfaces of (a) HDAC6 in its complex with inhibitor 1, and (b) HDAC3 (PDB 4A69) with inhibitor 1 modeled in the active site based on structural alignment with the HDAC6–1 complex. Zn2+ ions appear as grey spheres and metal coordination interactions are represented by solid yellow lines. The active site of HDAC6 is wider and more readily accommodates phenylhydroxamate inhibitors with bulky para-substituted substituents.

