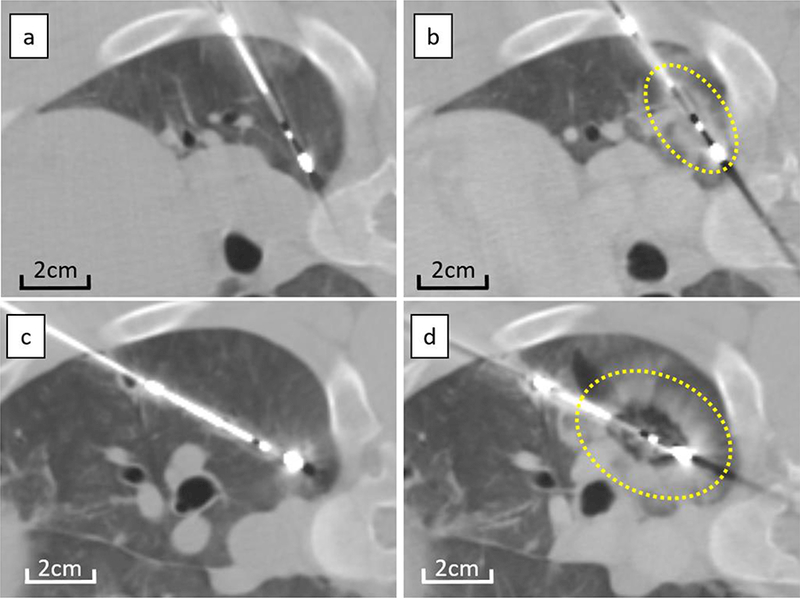
Figure 1. Serial change of CT image following microwave ablation at high power.

CT images taken before ablation (a,c) and within 10 minutes after ablation (b,d) for short (a,b) and long (c,d) duration energy delivery. Compared to CT before ablation (a, c), low density area appeared around the electrode, surrounded by ill-demarcated consolidation on CT immediately after both short (b) and long duration (d) energy delivery. Ablation after long duration (d) treatment appears more spherical when compared to short duration (b) of energy delivery. Dotted lines demarcate the ablation zone from untreated lung.
