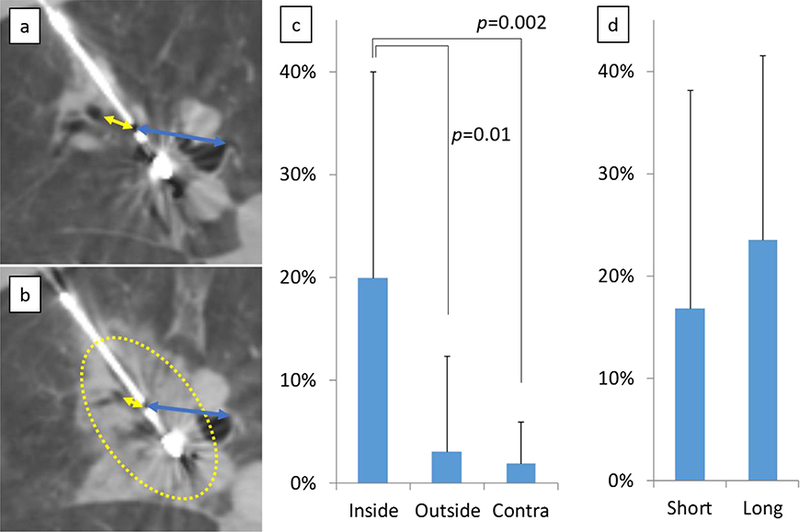
Figure 4. Distortion of lung tissue following high power microwave ablation.

Distances between the center of the ablation zone, and bronchus or large vessels both inside (yellow arrow) and outside (blue arrow) the ablation zone were measured on CT images before (a) and immediately after ablation (b). The distance between the ablation center and these structures decreased significantly within the ablation when compared with structures outside the ablation zone, or equivalent measurements performed in untreated contralateral lung. (c). The distortion ratio between short (2 min) and long duration (10 min) was not significantly different (d). Dotted lines demarcate the ablation zone from untreated lung.
