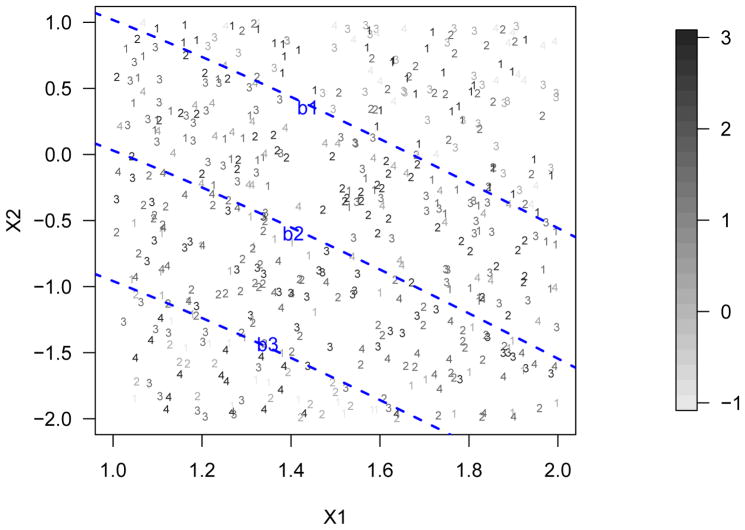
Figure 1.
A simulation example explaining how the monotonic property works. In this case, there are two covariates and four treatment levels where the numbers represent the actually assigned treatments. The gray-scale of the numbers indicates the clinical outcome value and a darker color means a larger reward (see the gray-scale strip). The dashed lines indicate how the optimal ITR boundaries split the input space.

