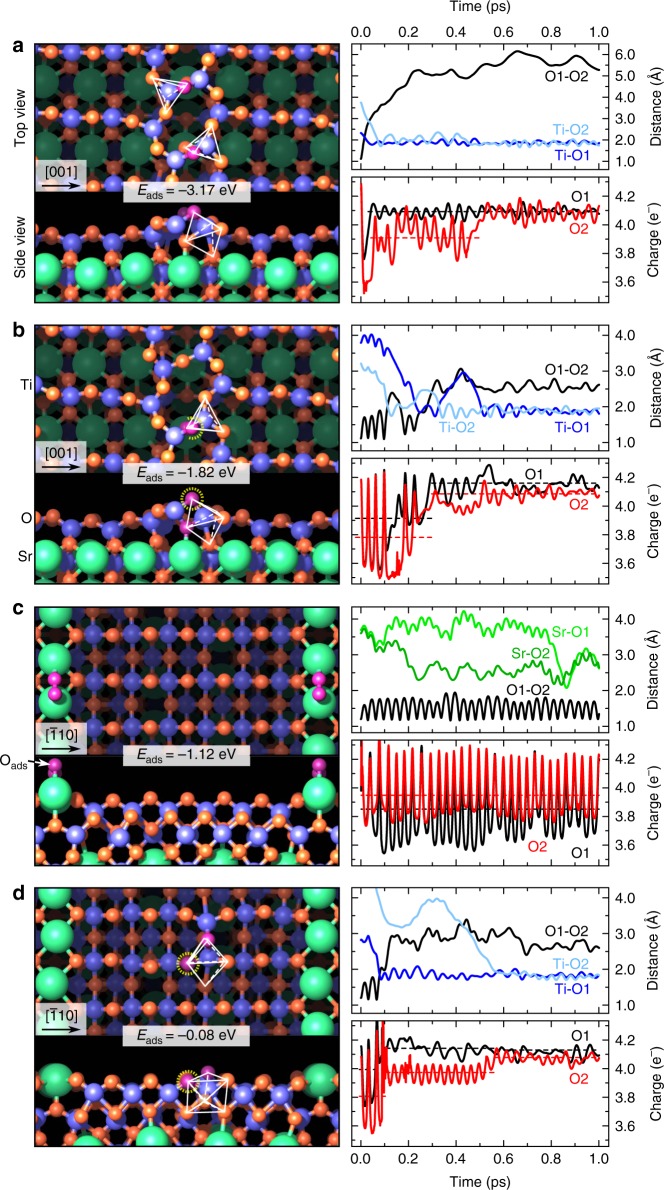
Fig. 4.
O2 adsorption structures and O2 dynamics calculated by FPMD-DFT. Lowest-energy structural models and time evolution (first 1.0 ps; for later time the results remain unchanged) of selected ionic distances and charge populations during the adsorption of one O2 on a the (n × 1) and c the (2 × n) surfaces without a vacancy, and on b the (n × 1) and d the (2 × n) surfaces with one VO (the O atom filling the VO is highlighted with a dashed yellow circle). Adsorption energies are indicated, and take into account also the VO formation energy. Green, red, and blue spheres indicate Sr, O, and Ti atoms, respectively. The intact, adsorbed O2 molecule and the O atoms resulting from its dissociation are depicted in purple. Five- (a, b) and sevenfold (d) coordination polyhedra of Ti are outlined in white. O1 and O2 refer to the oxygen atoms belonging to the O2 molecule, while Ti–O1 (Ti–O2) is the distance between O1 (O2) and the closest Ti atom in the structure

