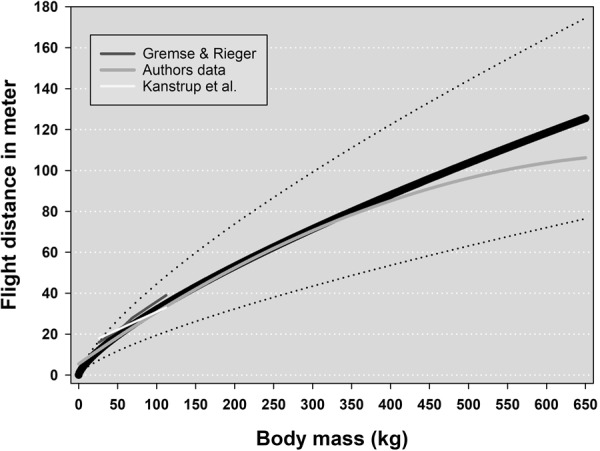
Figure 6.

Expected flight distances suggested by the model for mammals with body masses ≤650 kg. The solid black line represents the average values and the stippled lines the standard deviation. The short white line exhibits average values of flight distances for four species (roe deer, fallow deer, wild boar, and red deer) with increasing body masses16. The short dark gray line shows average flight distances for roe- and red deer17. The long light gray line is the regression line representing flight distances for red fox, roe deer, brown bear, and moose calves, yearlings and adults (our own data).
