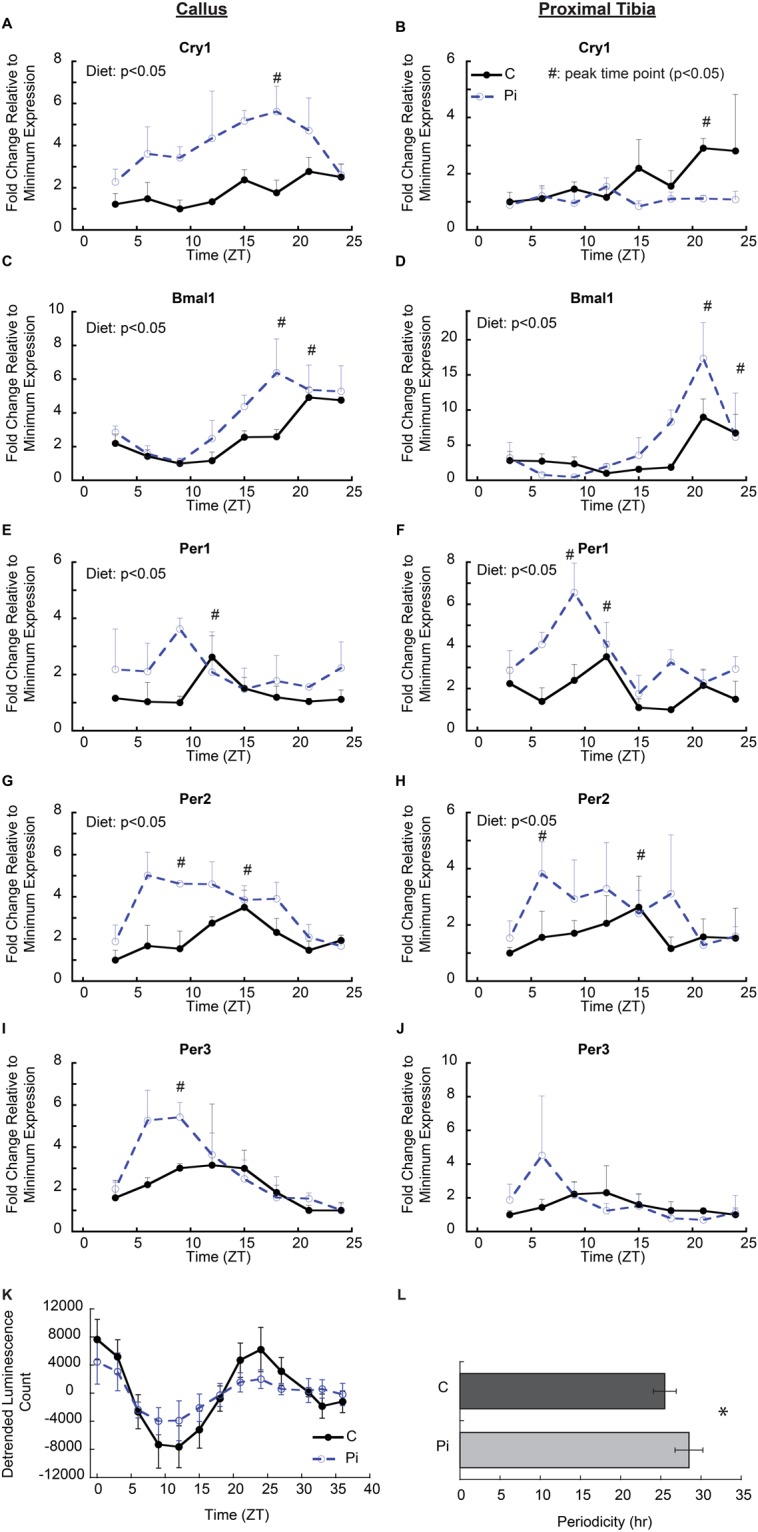
Figure 3.

Alteration of circadian regulatory gene expression by hypophosphatemia in callus and growth plate tissues. (A–J) mRNA expression of central circadian clock genes in callus and growth plate tissue isolated over a 24 hour period 12 days after the mice were placed on a hypophosphatemic diet. Tissues were harvested every three hours from mice in both groups (n = 3, in each group by time points). Error bars represent ±1 standard error of the mean of the 2–3 repeat analyses performed on six samples per group. #Indicates peak time point (p < 0.05); A significant diet effect in two-way ANOVA (p < 0.05) is indicated in the upper left of the figure. (K) Analysis of Per2-driven bioluminescence in callus tissues of control (C) and hypophosphatemic (Pi) animals when cultured ex vivo over a 39 hour period in medium containing 1.0 mM or 0.25 mM phosphate, respectively. (L) Bar graphs of detrended data calculating the periodicity of Per2 in control (25.12 ± 1.45 hours) and Pi (27.86 ± 2.45 hours) (p = 0.023). n = 8 in each group.
