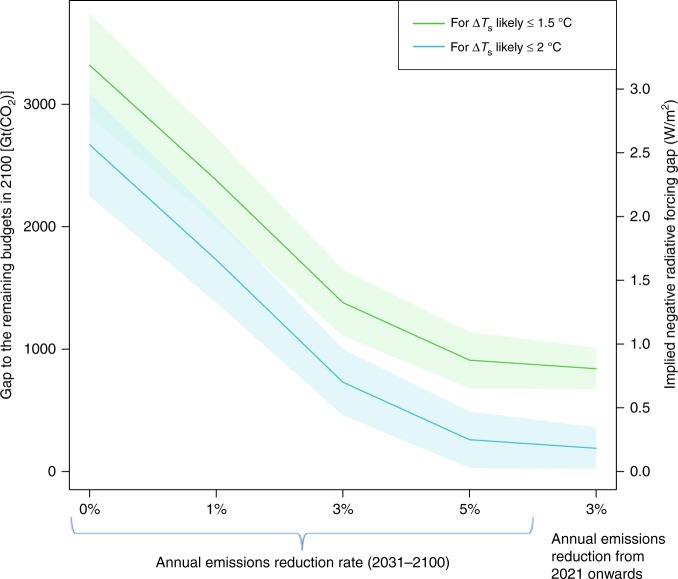
Fig. 2.
Gaps to the Paris Agreement temperature goals. The emissions gaps [Gt(CO2)] between computed cumulative CO2 emissions between 2015 and 2100 and the remaining budgets to the cumulative emissions amounts that keep below 1.5 °C (green line) and 2 °C (blue line) with a 66% likelihood are shown for several scenarios. The remaining budgets are based on data from an IPCC analysis of model ensemble output3, yielding 650 ± 130 Gt(CO2) to 1.5 °C and 1300 ± 130 Gt(CO2) to 2 °C. The first four scenarios are based on fulfilment of the Paris Agreement NDCs by 2030 and various rates of annual emissions reductions thereafter. The last scenario is for an annual emissions reduction rate of 3%/yr starting already in 2021. The shading represents the lower and upper bound values computed for each temperature goal, and the solid line is the mean of these. The right side axis shows the implied negative radiative forcing [W/m2] associated with the CO2 budget gap values, using a conversion factor of 9.6 x 10⁻⁴ (W/m2)/(Gt(CO2). For further information and computations, see Methods and Supplementary Table 1

