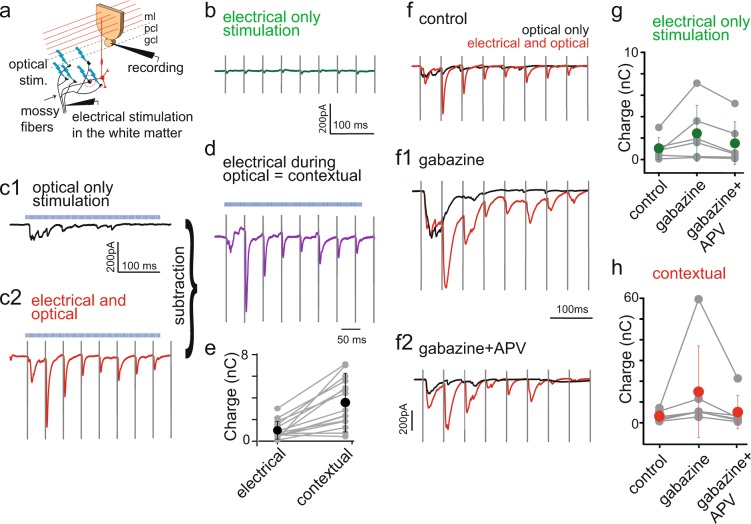
Figure 6.
Contextual gating of salient mossy fiber inputs by ongoing optogenetic stimulation. (a) Schematic drawing explaining experimental pairing protocol. Cerebellar cortex output activity was measured by recording Purkinje cells in whole-cell configuration. Minimal electrical stimulation of mossy fibers was applied by placing stimulation electrode few hundreds of µm away from the recorded cell body and applying 1 ms pulse at 20 Hz (50 ms interpulse interval) for 4 s. This input was superimposed with the asynchronous stimulation evoked optically (represented by blue lightings), similarly as in previous experiments (Fig. 5). (b) Examples of traces from a single cell showing response recorded in Purkinje cell to electrical only stimulation. (c) Examples of traces from a single cell showing response recorded in Purkinje cell to (c1) optical only stimulation, (c2) paired electrical and optical stimulation. (d) Trace presenting net electrical stimulation in the context of optical stimulation (contextual charge transfer), calculated by subtracting optical only stimulation from the paired stimulation. (e) Summary of the contextual charge transfer (calculated as in d) during the whole period of paired electrical and optical recording; blue dots represent averages ± s.d., grey pairs of points represent single cells (n = 15). (f) Contextual gating in the granular layer is under the control of Golgi cell. Examples of traces from a single cell showing response recorded in Purkinje cell to optical only (black trace) or paired electrical and optical stimulation (red trace) in (f) control condition, (f1) after gabazine and (f2) gabazine and APV bath-application (same cell as in c1-c2). (g) Summary of average charge transfer during the electrical only stimulation in three pharmacological conditions: control, bath applied gabazine and bath applied gabazine and APV; error bars represents ±s.d. (n = 6). (h) Summary of the contextual charge transfer (calculated as for d and e) in three pharmacological conditions (n = 6). Vertical lines in b, c1-c2,d and f-f2 are electrical stimulation artefacts to better visualize the timing of the evoked responses; horizontal, blue dashed line represents optical stimulation.

