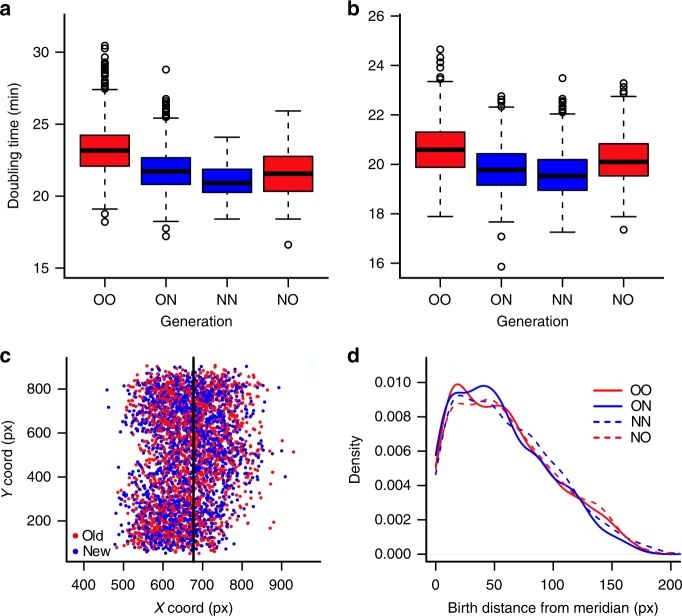
Fig. 2.
Doubling time asymmetry in the absence of starvation and stress. a Bacteria from the mother machine were categorized as OO, ON, NN, and NO (n = 882, 882, 105, 105 cells), reflecting their polarity and position within the growth traps. ON cells displayed faster doubling times than OO. Similarly, NN grew faster than NO (two-tailed paired t-test, t = − 2.308, df = 104, p = 0.023) despite the latter being closer to the nutrient source. b Doubling times of OO, ON, NN, and NO cells (n = 556, 556, 620, 620 cells) from the daughter device showed the same pattern as in the mother machine. The doubling time relationships OO > ON (t = − 17.219, df = 555, p < 0.001) and NO > NN (t = − 13.564, df = 619, p < 0.001) were again verified by two-tailed paired t tests. Boxplots show median (center line), first and third quartiles (box limits), and minimum and maximum (whiskers). c Representation of cells within the chamber, according to their coordinates at birth. The vertical line represents the midline of the chamber, which is open along the Y axis on both sides. d We analyzed the data from c by measuring the distance of each cell from the midline of the chamber at the moment of birth, and verified no localization bias among sibling pairs within the daughter device (OO–ON p = 0.12 and NO–NN p = 0.98, Wilcoxon signed-ranks test). Therefore, doubling time differences represent and effect of aging as opposed to starvation

