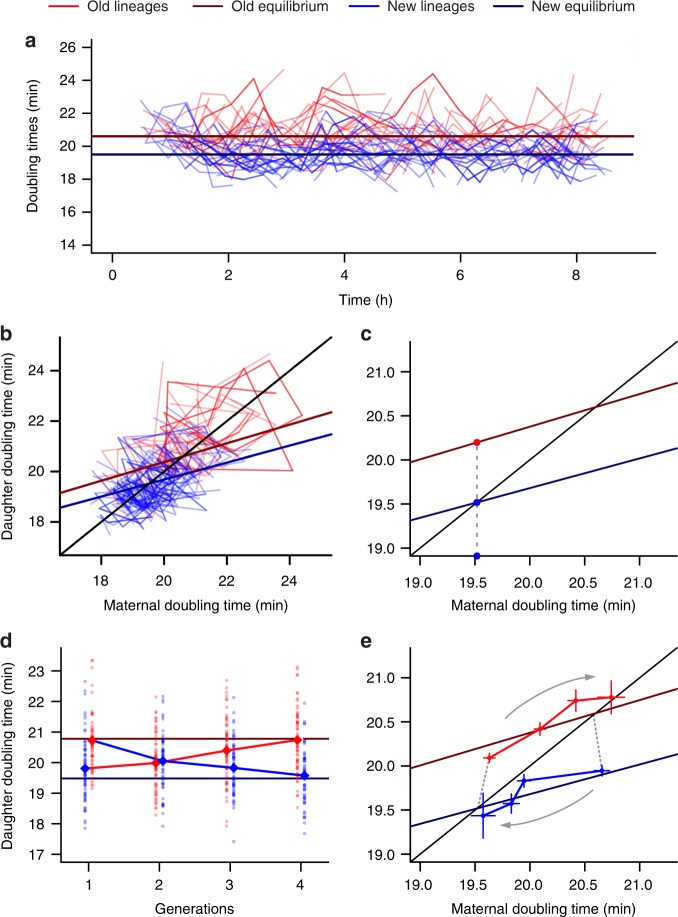
Fig. 4.
New and old daughters reach equilibrium in the daughter device. a New (19.365 ± 0.907, n = 158) and old lineages (21.177 ± 1.237, n = 116), represented by those inheriting the same pole for at least 4 generations, exhibited stably distinct doubling times (t = 13.354, df = 200.66, p < 0.001, one-tailed t-test) over time. b By following these lineages on the phase plane, we determined the equilibrium points based on the linear relationships between T0 and T1 or T2. A two-way ANCOVA revealed a significant effect of T0 (F = 460.3, p < 0.001) and age (F = 334.2, p < 0.001) on daughter doubling times (n = 2400), with both linear models displaying similar slope (F = 1.051, p = 0.305). c Graphical representation of two daughters born from a mother at T1 equilibrium. Although its new daughter remains at equilibrium, its old daughter displays a longer doubling time. d Old lineages born from T1 equilibrium (generation 1) converge towards T2 equilibrium over three generations. The same is observed for new lineages born from T2 equilibrium, which converge towards T1 equilibrium over time. e In the phase plane, we can observe the trajectory of cells born from the opposite equilibrium as they consecutively approach the equilibrium that matches their polarity. Error bars represent mean ± SEM. Old lineage n = 370, 179, 70, 30; new lineage n = 291, 139, 62, 24 cells

