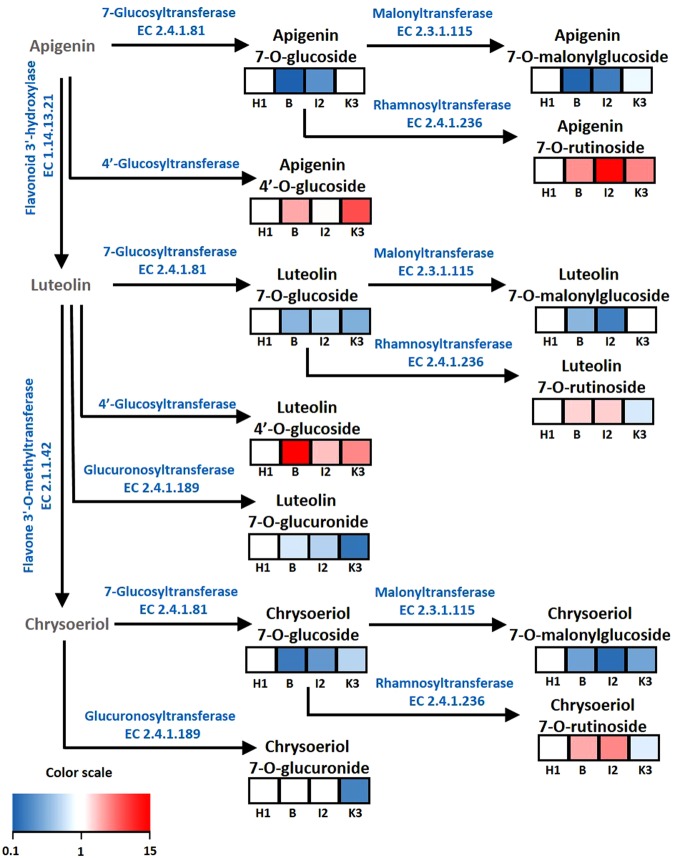
Figure 3.
Biosynthetic pathway and patterns of accumulation of major flavonoids in different carrot genotypes. Indicated flavonoids were quantified in carrot leaf samples in a 3-year evaluation. Heat maps show fold changes in the accumulation of each flavonoid among the H1, Boléro, I2 and K3 genotypes, presented from left to right. Fold changes are indicated according to the scale bar and were calculated for each compound based on the content in the H1 genotype (auto-scaled values). The biosynthetic pathway was based on the KEGG « Flavone and flavonol biosynthesis » pathway (map00944, Kanehisa et al., 2017).

