Fig. 4.
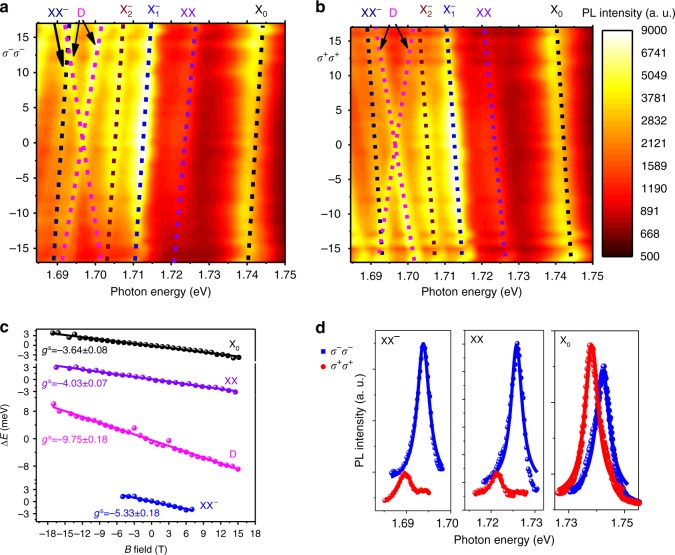
Magneto-PL spectra of WSe2. a, b Color plot of the PL spectra of WSe2 as a function of B field at 4.2 K for the σ−σ− and σ+σ+ configuration. The dashed lines are the eye guide to the shift of different PL peaks. c g-factors for different peaks calculated from the Zeeman splitting between the σ−σ− and σ+σ+ states as a function of B field, extracted from the magneto-PL spectra in a and b. d PL spectra for (σ−) excitation and σ+(σ−) detection of exciton, biexciton and trion–exciton complexes, respectively (B = 17 T)

