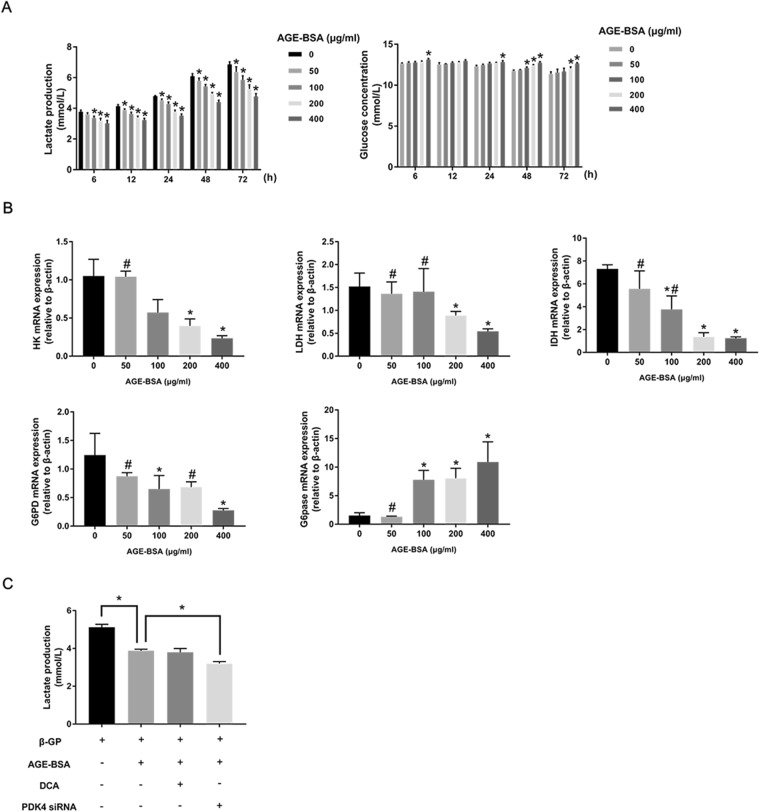
Figure 6.
AGEs suppressed glycolysis during VSMC calcification. (A) Lactate production and glucose concentrations were analyzed at different time points after AGE-BSA treatment. *P < 0.05 compared with the control group. (B) HK, LDH, IDH, G6PD, and G6pase expression levels in calcified VSMCs after AGE-BSA exposure were determined by qRT-PCR. *P < 0.05 compared with the control group. #P < 0.05 compared with the AGE-BSA (400 μg/ml) group. (C) Calcified VSMCs were pretreated with DCA or PDK4 siRNA and then treated with AGE-BSA (200 μg/ml) for another 24 h. Lactate production was measured by the lactate assay kit. *P < 0.05 vs. the indicated treatment.

