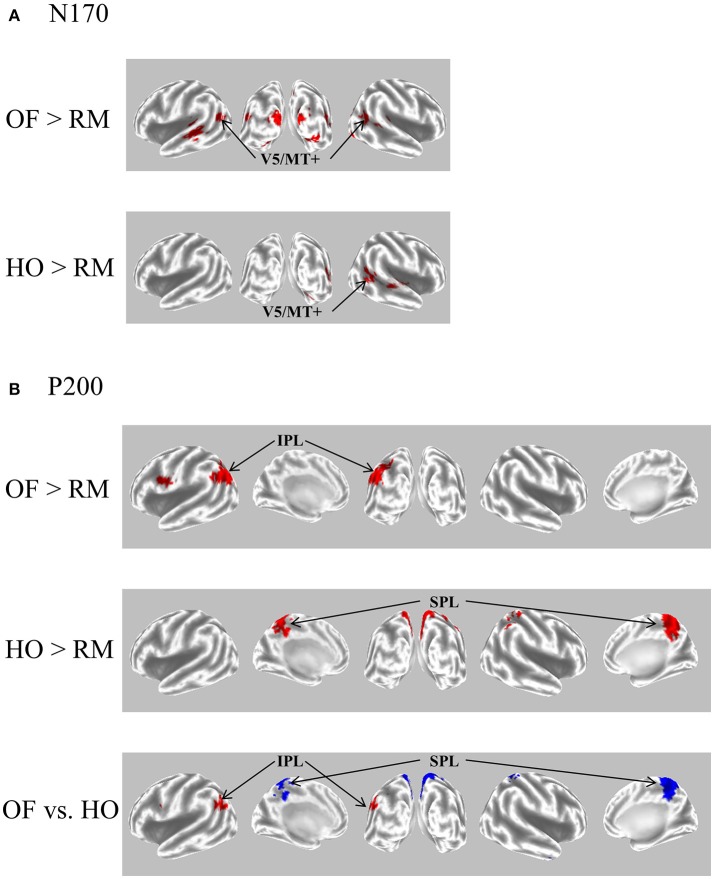
Figure 5.
eLORETA-based statistical nonparametric maps for a comparison between OF and HO in GFP peaks of N170 and P200. (A) The current density of N170 was significantly elevated over the occipito-temporal areas including V5/MT+ in both stimulus conditions. (B) The current density of the parietal P200 for OF was significantly elevated in the left IPL (BA 39/40). Conversely, there was a significant elevation of the current density of the central P200 for HO in the bilateral SPL (BA 7). In the figure at the bottom, red and blue mean OF and HO, respectively. Please note that this figure was presented at 2009 International Symposium on Early Detection and Rehabilitation Technology of Dementia. December 11–12, 2009, Okayama, Japan. eLORETA, exact low resolution brain electromagnetic tomography; GFP, global field power; RM, random motion.

