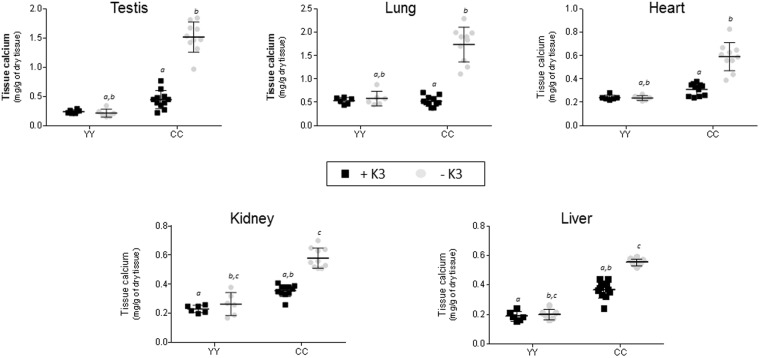
Figure 3.
Tissue calcium content in testis, lung, heart, kidney and liver of 4 months old-YY or CC rats fed with standard diet (black square) or special diet –K3 (gray circle) since the weaning. Results are expressed as mean ± SD. n = 6 for groups YY and n = 11 and 10 for groups CC+K3 and CC−K3 respectively. Statistical analysis was performed using Tukey’s multiple comparisons test. Statistic difference was reported when only a unique variable between groups is modified (either genotype or diet). P < 0.01 was the accepted level of significance. a,b,c: statistical difference between 2 groups.

