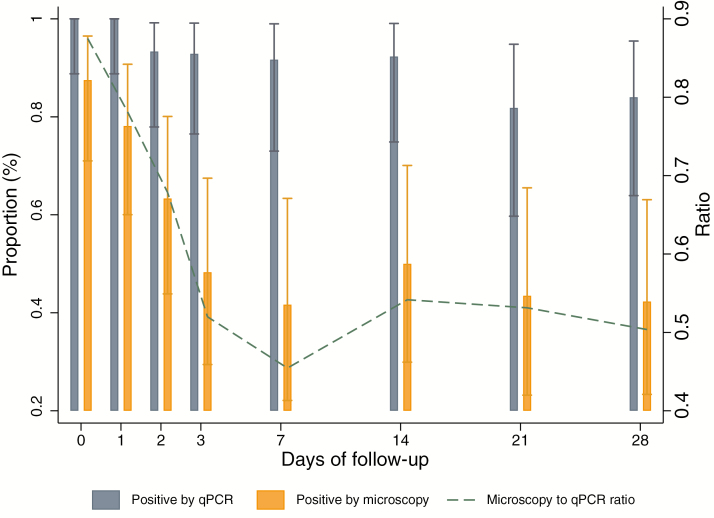
Figure 4.
Proportion of positive samples by real-time quantitative polymerase chain reaction and microscopy per follow-up observation (bars, left y axis), and ratio of samples detected by polymerase chain reaction and microscopy through time (line, right y axis) during the follow-up of 32 afebrile Plasmodium falciparum–infected individuals at baseline. Abbreviation: qPCR, quantitative polymerase chain-reaction.

