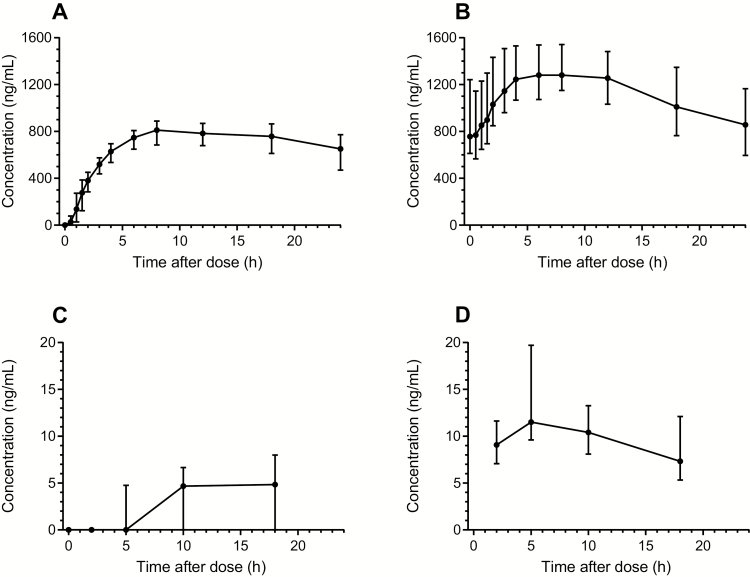
Figure 3.
Concentration-time curves for carboxyprimaquine. A and B, Venous carboxyprimaquine samples. C and D, Carboxyprimaquine concentrations in breast milk. The concentration-time curves have been stratified on sampling day 0 (A and C) and sampling day 13 (B and D). Mean and 95% confidence interval are shown.

