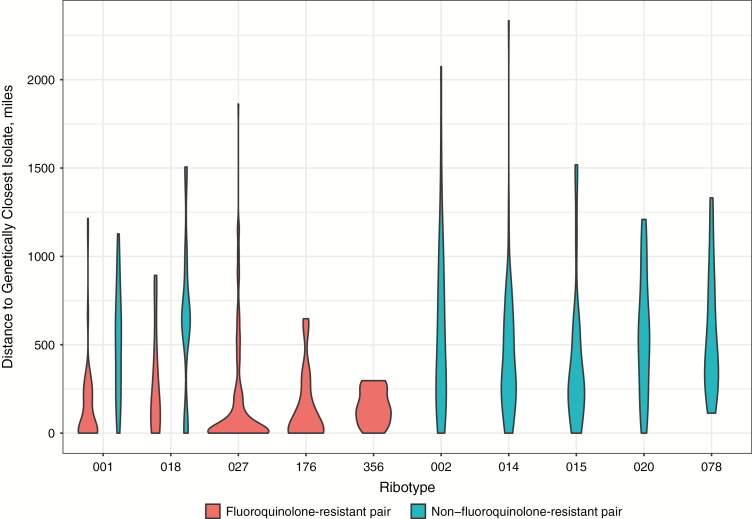
Figure 5.
Geographic distance to genetically closest isolate, by ribotype and fluoroquinolone resistance. Within each ribotype, a minimum spanning tree was constructed using genetic distances measured in single-nucleotide polymorphisms (SNPs) as edge weights and isolates as nodes. The properties of the edges of the minimum-spanning tree are plotted, such that each isolate but 1 contributes 1 data point. Fluoroquinolone-resistant pairs of isolates were both fluoroquinolone resistant, and non–fluoroquinolone-resistant pairs were either both or only 1 susceptible. One pair of ribotype 014 isolates were both fluoroquinolone resistant, as were 2 pairs of ribotype 078 isolates; however, these are insufficient to estimate a kernel density to plot.

