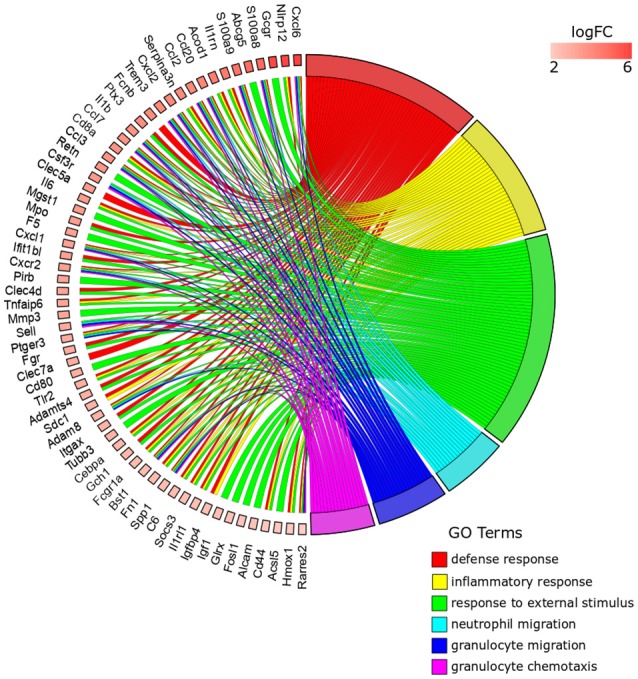
Figure 5.

GOChord plot of top six ranked overrepresented GO terms belonging to the Biological Process subontology for Anisakis-infected rat muscle. The genes are linked to their assigned terms via colored ribbons. Genes are ordered according to the observed log-fold change (logFC), which is displayed in descending intensity of red squares displayed next to the selected genes.
