Figure 1.
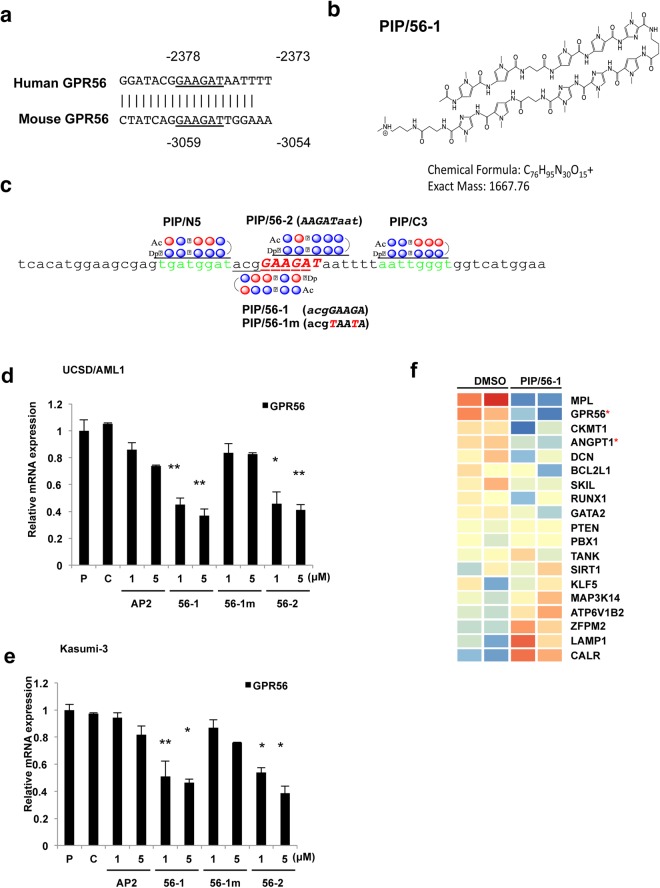
Target sequence and structure of the PIPs targeting the GPR56 gene promoter and their effects on GPR56 expression. (a) Sequence comparison of the EVI1-binding sites between human and murine GPR56 promoter regions. The underlined sequence (−2378 to −2373 for human and −3059 to −3054 for murine) is a well-conserved binding sequence of the EVI1 transcription factor. (b) Chemical structure of the PI polyamide PIP/56-1 with its chemical formula and molecular weight. (c) Location of the target sequences of each PI polyamide in the human GPR56 promoter region is shown with each synthesized PIP. PIP/N5 covers −2389 to −2382 (tgatggat), PIP/56-1 covers −2381 to −2374 (acgGAAGA) of the EVI1-binding sequence, PIP/56-1 m is a mismatch PIP for PIP/56-1 with two nucleotide substitutions shown in red, PIP/56-2 covers −2377 to −2370 (AAGATaat) with the EVI1-binding sequence (underlined), and PIP/C-3 covers −2366 to −2359 (aattgggt). Red circles: Py N-methylpyrrole (Py); blue circles: Im N-methylimidazole (Im); β: β-alanine; Ac: Acetyl; Dp: N,N-dimethylaminopropylamine): γ-aminobutyric acid. (d,e) Expression of GPR56 in EVI1high AML (UCSD/AML1 and Kasumi-3) measured by real-time RT-PCR 24 hours after the treatment with increasing concentrations (1 or 5 μM) of each PIP (AP2, 56-1, or 56-2). Parental cells were not treated (P) or were treated with the solvent of PIPs (0.1% DMSO) (C) as controls. Data represent the mean ± S.D. of triplicate determinations and are presented relative to control (parental). **P < 0.01 between parental control and treated cells (Student’s t-test). (h) The heat-map showing expression of 19 known EVI1 regulated genes in UCSD/AML cells treated with and without PIP/56-1. The expression of these 19 genes were reported to directly or indirectly regulated by EVI125–27. Heatmaps were generated in GeneSpring with microarray data from UCSD/AML cells with GPR/56-1 and control DMSO. Red and blue indicate up- and down-regulation for each gene, respectively. Asterisks (*) indicate significant differences between DMSO-treated and PIP/56-1-treated UCSD/AML cells (Student’s t-test, P < 0.05).

