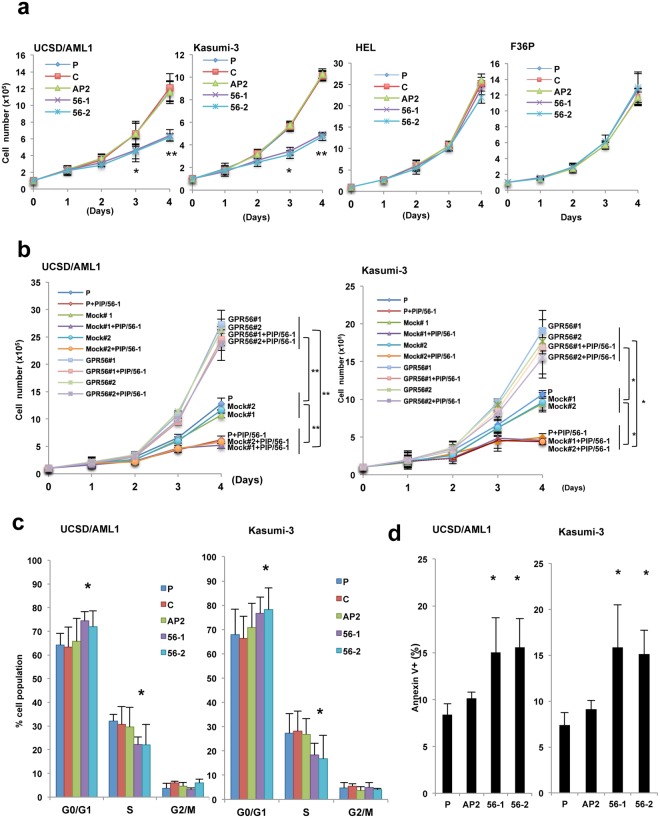
Figure 3.
Suppression of cell growth by PIP/56-1 or PIP/56-2 treatment in EVI1high AML cell lines. (a) Cell growth rates of two EVI1high AML cell lines (UCSD/AML1 and Kasumi-3) and two EVI1low AML cell lines (HEL and F36P) were examined after 1 μM PIP/AP2 (AP2), PIP/56-1 or PIP/56-2 treatment and parental cells (P) with no treatment or with DMSO only (C) as controls. Data represent the mean ± S.D. of triplicate determinations. *P < 0.05, ** P < 0.01 between parental control and treatments (Student’s t-test). Data are representative of three independent experiments. (b) Two EVI1high AML cell lines, UCSD/AML1 and Kasumi-3, treated with 1 μM PIP/56-1 for 24 hours were transfected with GPR56 expression vector or empty vector, and cell proliferation rates were determined by Trypan blue staining. Data represent the means ± S.D. of triplicate determinations. *P < 0.05, **P < 0.01 (Student’s t-test). (c) Cell cycle profiles were determined by BrdU labeling from two EVI1high AML cell lines (UCSD/AML1 and Kasumi-3) treated with 1 μM PIP/56-1, PIP/56-2, PIP/AP2 or DMSO solvent (C) for three days and parental cells (P). Data represent the mean ± S.D. of three independent experiments. *P < 0.05 between parental control and treatments (Student’s t-test). (d) Percentage of apoptotic cells determined in two AML cell lines (UCSD/AML1 and Kasumi-3) under the same conditions as in (a,b) by Annexin V staining. Data are expressed as the percentage Annexin V-positive cells 24 hours after treatment and represent the mean ± S.D. of three independent experiments. *P < 0.05 between parental control (P) and treatments (Student’s t-test).

