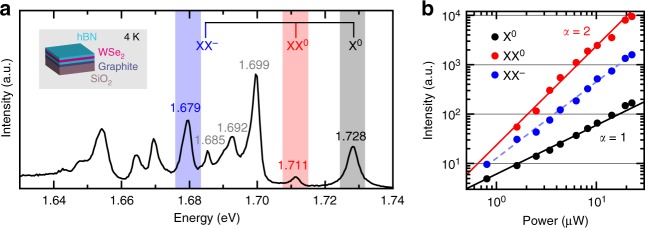
Fig. 1.
PL spectrum and power dependence of encapsulated 1L-WSe2 at 4 K. a PL spectrum (black curve, linear scale) of encapsulated 1L-WSe2. Excitation wavelength: 658 nm. The top part of the figure lists the calculated spectral locations of X0 (grey), XX0 (red) and XX− (blue) in the presence of a screening environment. b Double logarithmic plot of PL intensity as a function of excitation power for X0 (black filled circles), XX0 (red filled circles) and XX−(blue filled circles). The solid curves represent I ∝ Pα for a quadratic (α = 2, red) and linear (α = 1, black) behaviour. The dashed blue curve is a fit to PL intensity, yielding an α of 1.55. For clarity of display, we multiply XX0 by 4 and X0 by 0.4

