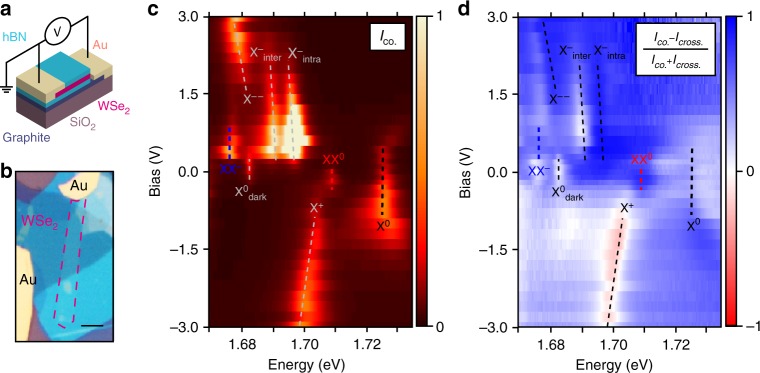
Fig. 2.
Charge dependence of PL. a Schematic and b optical image of the charge-tuneable device. The red dashed frame highlights the 1L-WSe2 flake. The scale bar is 5 μm. c Circular co-polarised PL intensity (Iσ+/σ+ + Iσ-/σ-) as a function of applied bias. The dashed lines are a guide to the eye to highlight each peak. d DoP of PL as a function of bias and energy in the same range as (c). The colour code is such that blue regions indicate co-polarisation, whereas the red regions indicate counter-polarisation with respect to excitation polarisation

