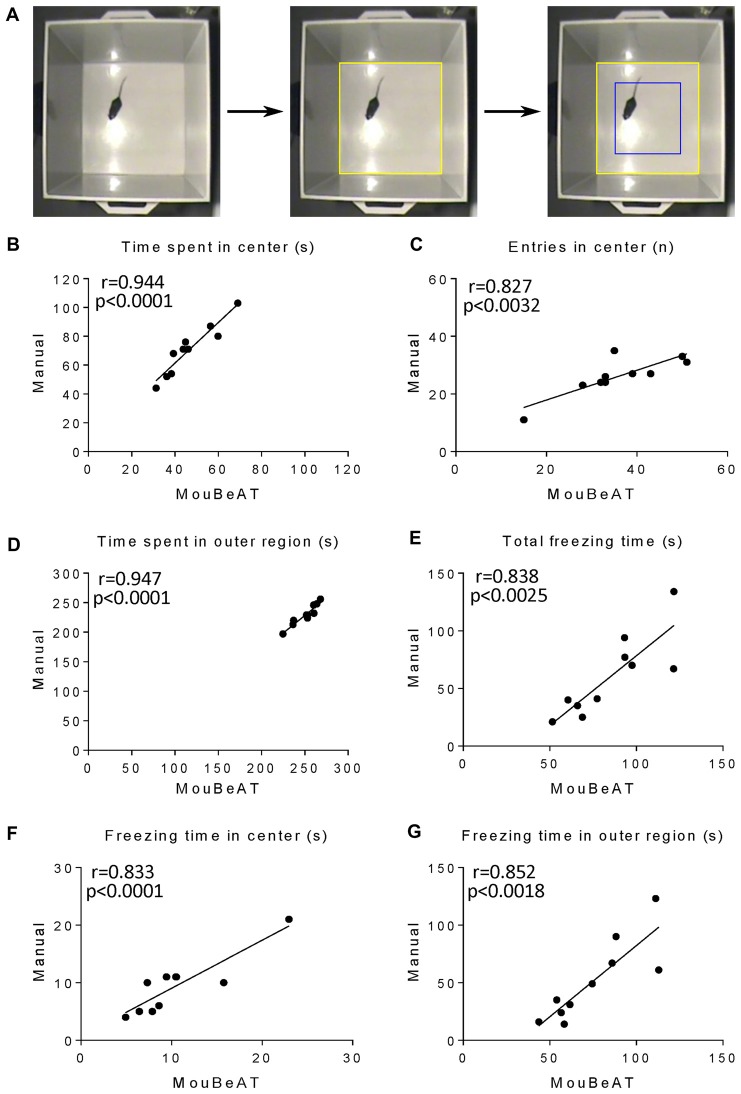
Figure 2.
Correlation of the measured variables in the open field (OF) test between MouBeAT and manual assessment. The OF test (A) was performed using 10 C57BL/6J male mice. Yellow ROI defines the base of the cube while blue ROI indicates the center region calculated by the software. Each dot represents time spent in the center (B), number of entries into the center (C), time spent in outer region (D), total freezing time (E), freezing time in the center (F) and freezing time in the outer region (G) for each mouse. In this and all subsequent Figures Pearson’s correlation coefficients were calculated for all variable except in cases where data followed a non-parametric distribution, in which case the Spearman correlation coefficient was used. Individual p values are displayed in the Figures. For (F) the Spearman correlation coefficient was used.

