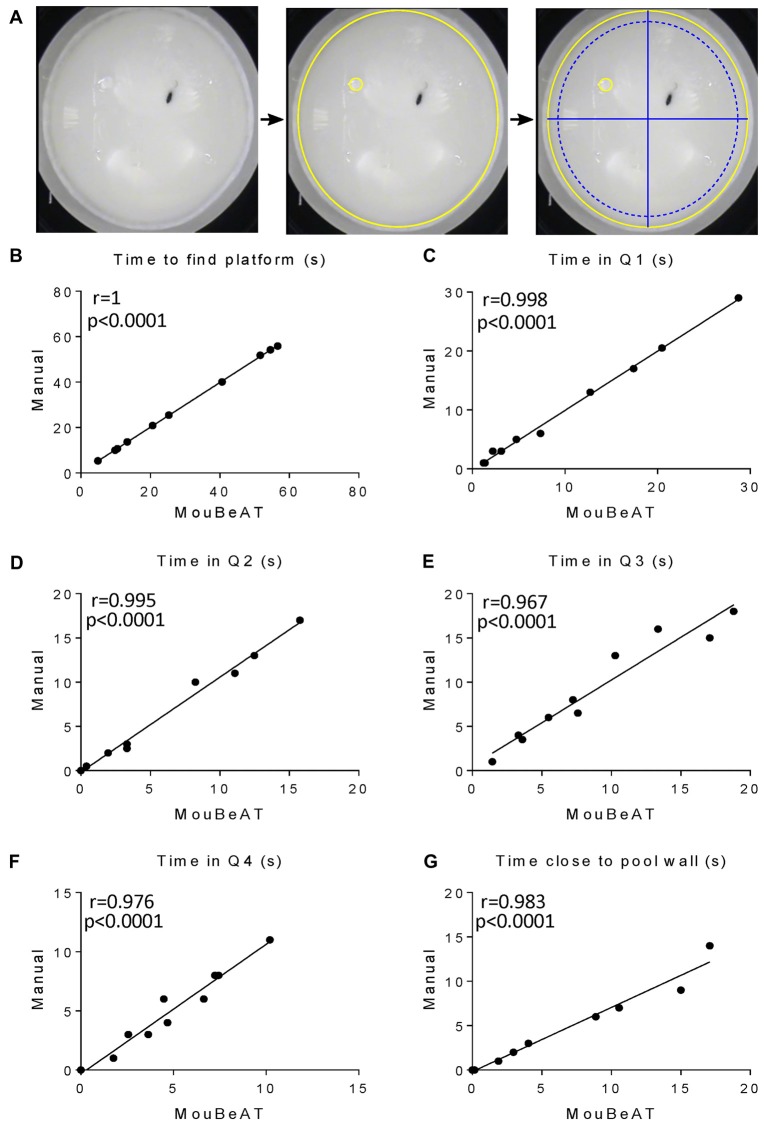
Figure 6.
Correlation between MouBeAT and manual assessment of different parameters in the Morris Water Maze (MWM) test. The MWM test (A) was performed on 10 C57BL/6J male mice. Yellow ROI defines the edges and the platform regions, while blue ROIs define the quadrants and the region close to the pool wall, calculated by the software. Each dot represents the time needed by the mouse to find the platform (B), time in quadrants 1–4 (C–F) and the time spent close to the pool wall (G) for each mouse.

