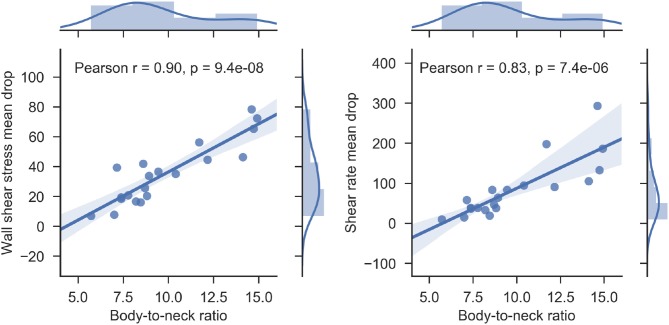
Figure 12.
Scatterplot of body-to-neck ratio vs wall shear stress mean drop index (left) and body-to-neck ratio vs. shear rate mean drop index (right) for each of the MAs studied. Regression lines and associated correlation coefficients are given to demonstrate the good correlation between the pairs of variables. The marginal histograms in each of the plots present the distribution of each of the variables studied.

