Figure 2.
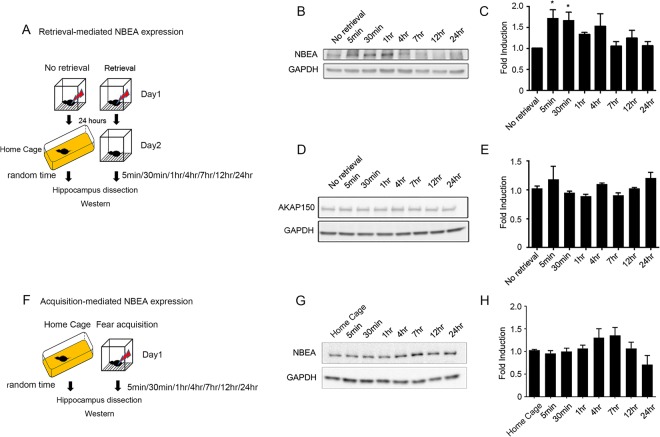
The increase in NBEA expression was rapid and transient after contextual fear retrieval at the synapse in the dorsal hippocampus. (A) Schematic representation of the experimental protocol. Mice in the no-retrieval group were handled as the same as the retrieval group on Day 1 but were not exposed to the same context on Day 2. Random time means the no-retrieval group was sampled randomly, but most of the samples were taken between the 1 hr and 4 hr sampling intervals after fear retrieval. (B) Representative image of the time course of NBEA expression after retrieval. No-retrieval samples were obtained from mice that were fear conditioned and sacrificed 24 h after conditioning without retrieval. (C) Quantification of the time course of NBEA expression after retrieval. There was significant induction in NBEA expression at 5 min and 30 min after contextual fear retrieval. F(7, 39) = 2.793, *p = 0.0187, one-way ANOVA with post hoc Dunnett’s multiple comparisons test: No retrieval (1.005 ± 0.003658, n = 6) vs 5 min after retrieval (1.713 ± 0.2036, n = 5), *p = 0.0328; no retrieval vs 30 min after retrieval (1.661 ± 0.2003, n = 6), *p = 0.0400; no retrieval vs 1 h after retrieval (1.339 ± 0.04178, n = 6), p = 0.5568; no retrieval vs 4 h after retrieval (1.529 ± 0.2942, n = 6), p = 0.1411; no retrieval vs 7 h after retrieval (1.056 ± 0.1076, n = 6), p = 0.9997; no retrieval vs 12 h after retrieval (1.25 ± 0.1824, n = 6), p = 0.8216; no retrieval vs 24 h after retrieval (1.069 ± 0.09385, n = 6), p = 9996. (D) Representative image of the time course of AKAP150 expression after retrieval. (E) Quantification of the time course of AKAP150 expression after retrieval. There was no significant difference in AKAP150 expression after contextual fear retrieval. F(7, 28) = 2.021, p = 0.0877, one-way ANOVA. (F) Schematic representation of the experimental protocol. Random time means the home cage group was sampled randomly, but most of the samples were taken between the 1 hr and 4 hr sampling intervals after fear training. (G) Representative image of the time course of NBEA expression after conditioning. Home-cage samples were obtained from mice directly taken from the home cage and sacrificed. (H) Quantification of the time course of NBEA expression after fear conditioning. There was no significant difference in NBEA expression after fear conditioning. F (7, 20) = 2.255, p = 0.0728, one-way ANOVA.

