Figure 1.
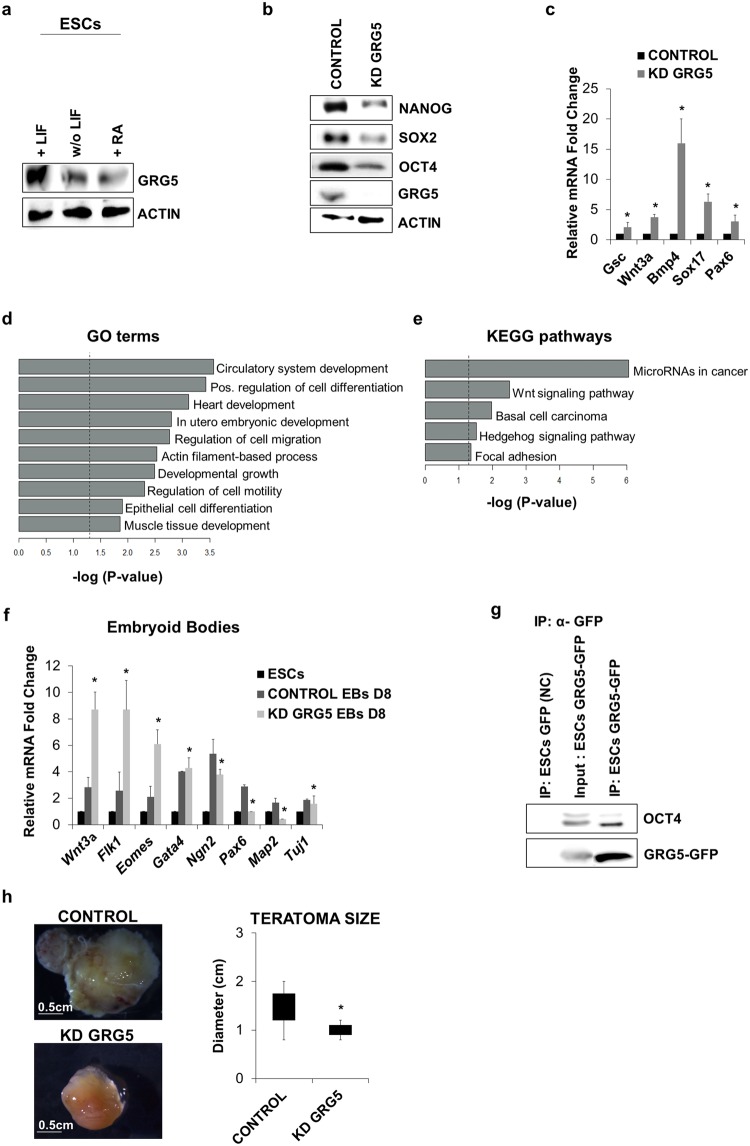
GRG5 is highly expressed in ESCs and its knock-down destabilizes cell pluripotent state. (a) Western Blot analysis of GRG5 in ESCs cultured in pluripotency promoting conditions (+LIF) and upon induction of differentiation through LIF withdrawal (w/o LIF) and 1 μM Retinoic Acid treatment (RA) for 3 days. (b) Protein levels of pluripotency factors upon depletion of GRG5. (c) Relative mRNA levels of differentiation markers in CONTROL and KD GRG5 ESCs. Mean + SD of n = 3 independent experiments. *P < 0.05 (d) Genes over-expressed in KD GRG5 ESCs were tested using g:Profiler73. The presented gene ontology (GO) terms belong to the top 20 of the significantly enriched GOs (log2FC ≥ 0.65, p-value ≤ 0.05, up to 1000 genes per GO). (e) Bar graph showing significantly enriched KEGG pathways. KEGG enrichment analysis was performed for the over-expressed genes in KD GRG5 ESCs using g:Profiler. (log2FC ≥ 0.65, p-value ≤ 0.05) (f) Differentiation of CONTROL and KD GRG5 ESCs through EBs formation. Mesodermal (Wnt3a, Flk1, Eomes), endodermal (Gata4) and neuroectodermal (Ngn2, Pax6, Map2, Tuj1) gene expression levels at Day8 of cell differentiation. Mean + SD of N = 4 independent experiments. *P < 0.05 (g) Co-immunoprecipitation assay showing interaction of GRG5 with OCT4 in ESCs. Whole cell lysates of ESCs expressing GFP (Negative control) or GRG5-GFP were immunoprecipitated with anti-GFP and immunoblotted with anti-OCT4. (h) Teratoma formation upon intramuscular injection of CONTROL and KD GRG5 ESCs in immunocompromised mice. Photos of the generated teratomas. (Scale bar, 0.5 cm). Box plot analysis of CONTROL and KD GRG5 teratoma size. Mean ± SD of n = 4 independent teratomas. *P < 0.05.

