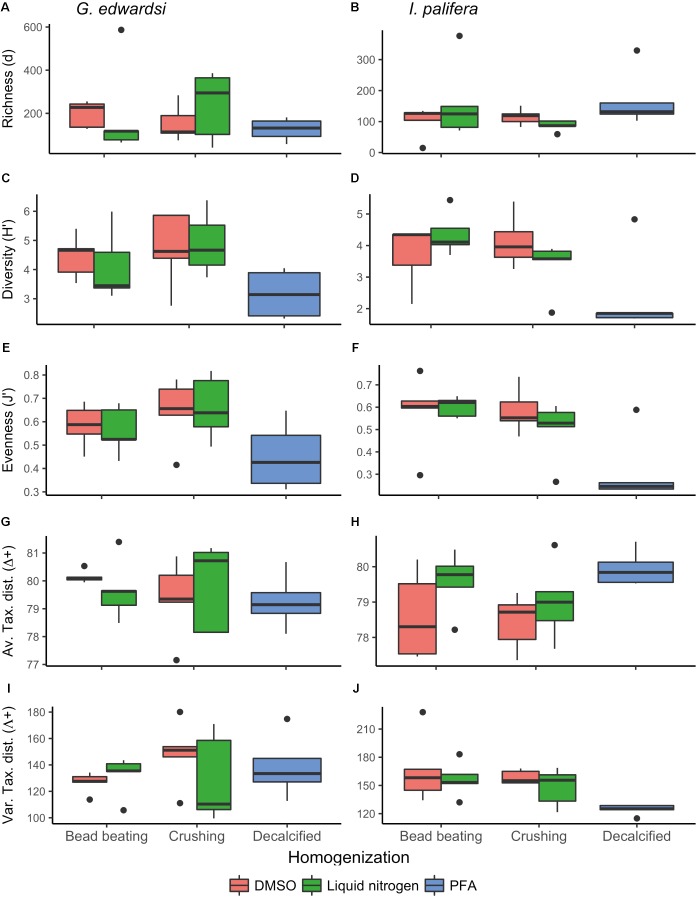
FIGURE 2.
Diversity metrics for Goniastrea edwardsi (A,C,E,G,I) and Isopora palifera (B,D,F,H,J) microbiome. No significant differences were detected in the diversity metrics of G. edwardsi microbiome (Supplementary Table 1). I. palifera microbiome showed differences between fragments preserved with PFA and DMSOCr in evenness, average, and variation of taxonomic distinctness, and LNBB in evenness and variation of taxonomic distinctness (PERMANOVA, Supplementary Table 2). Richness (d): Margalef’s index, Diversity (H′): Shannon diversity, Evenness (J′): Pielou’s evenness, Av. Tax. dist. (Δ+): Average of taxonomic distinctness, Var. Tax. dist. (Λ+): Variation of taxonomic distinctness. Boxplots are based on raw data after excluding chloroplast, mitochondria, unidentified, and unassigned OTUs.

